Abstract

When proposing and reviewing new developments, urban planners, architects and the broader public must make well-informed planning decisions that fit within the broader urban context to foster a sustainable future and avoid costly and unnecessary redevelopment later on. There is often no comprehensive, publicly available and data-based spatiotemporal body of knowledge to help support these decisions. This paper uses the City of Sydney (CoS) as a case study to show how open data about individual development applications (DAs) can be used to build a critical spatiotemporal information framework to fill this gap and guide important city-shaping design and planning decisions. This research proposes a novel and broadly applicable methodology based on Python data analysis and mapping to extract and visualise spatiotemporal insights from DA data in terms of DA lodgement numbers and locations, DA estimated costs, DA proposed land use and application processing times. The results show a consistent decrease in DA lodgement numbers since 2008, likely accentuated by the COVID pandemic since 2020. This is contrasted by a steady increase in the median cost of DAs since 2005. Development hot spots are identified in the Sydney CBD and the suburb of Zetland, whereas the western and central parts of the local government area (LGA) were found to be lodgement cold spots consistent with higher concentration of heritage conservation areas. DAs proposing new uses fall primarily in the retail category, followed by commercial land uses between 2005–2011 and residential uses since 2012. Analysis of DA assessment time showed that 76% of DAs were approved or refused within 3 months, with a positive but limited correlation between estimated cost and assessment time. All charts and maps are made available in an online dashboard.

Research Aim and Objectives

The aim of this research is to use available CoS DA data to perform a spatiotemporal investigation of the developments in this LGA during the nominated period. This will contribute towards filling the gap of publicly available, comprehensive, data-based spatiotemporal information about development patterns in the CoS area.

The following questions will be explored:
– What is the spatiotemporal distribution of developments?
– Is there a spatiotemporal pattern of development spending?
– Is there a pattern of evolution in different categories of proposed development use?
– How do assessment times vary between DAs?

This study also aims to develop an interactive dashboard comprising charts and maps from this study.

The dashboard comprises:
– DA hot and cold spots
– DA assessment time patterns
– DA estimated cost
– DA proposed usage patterns

Key Research Findings

DA Numbers and Locations

First, an overview of DA numbers is produced to understand the scale of development over the years (Figure 17). Excluding the years where data is incomplete (2004 and 2022), the number of DAs lodged is overall gradually increasing from 2005 to a peak in 2008, growing from around 2500 to over 3000 DAs per year. The numbers fluctuated from 2008 until 2013, before showing a downward trend, plateauing at 2000 DAs per year for the last 3 years. For 2022, based on a month-by-month comparison to the same periods in previous years (Figure 18), it seems that the DA numbers will at least continue at this level, if not dropping further. Overall, it is worth noting that the proportion of DAs refused is very low throughout the years, falling well under 200 cases per year (Figure 17).

Figure 17. Number of DAs lodged per year and their status distribution (2004–2022).
Figure 18. DAs lodged per month per year (2005-2022).

It is still difficult to tell if the low DA numbers since 2020 are directly linked to COVID-19. However, 2020 started with a similar number of DAs as previous years but dropped in comparison from April onwards (Figure 18). This timing is consistent with the beginning of the pandemic in Australia, with NSW cancelling major events from mid- March, and adding more restrictions until the first lockdown at the end of March 59. As restrictions gradually eased over April, May and June, June and July saw an increase in DA numbers before declining again with the number of DAs lodged seeing a significant drop in August (Figure 18). The lodgement rate stayed low until December 2020 (Figure 18), when it recovered as NSW controlled the first wave of the COVID-19 pandemic.

One general trend across all years is that the months of January and February always experience low lodgement rates but quickly climb to a peak in March. The low point corresponds to the Christmas break period, while the pinnacle occurs when all projects resume and actively start on development proposals for the new year. Similarly, the December period consistently sees a relatively high lodgement rate as people rush to complete projects by end of year.

A quick look at the year-by-year mapping of DAs (Figure 19) reveals that there clearly are areas that always have DAs as well as areas with almost no DAs through 2005 to 2021. The former includes locations such as the CBD and Alexandria, and the latter includes places such as Glebe and Redfern. This will be further examined later in the hot and cold spot analysis.

Figure 19. Locations of DAs by year marked in blue (2005-2021).

The global Moran’s I for developed areas is 0.03, which shows that development areas do not follow a predictable pattern. Across the whole study period, it is obvious from the space time cube and the hot spot analysis (Figures 21 and 22) that the northern portion of the LGA has always been a development hotspot. This includes localities such as Sydney (CBD), Haymarket and Elizabeth Bay. Other hotspots are found in certain southern localities, but to a lesser extent. This includes mostly the suburbs of Alexandria and Zetland and the northern part of Rosebery. This is not surprising as the study period largely coincides with the 20-year Green Square urban renewal process, which is located at the junction of Zetland, Alexandria, Waterloo, Rosebery and Beaconsfield 60. However, as the renewal process is coming to an end, most of the associated changes are either completed or under construction, hence the disappearance of hotspots in the more recent years.

Figure 21. Development hot and cold spots across all years, excluding minor DAs (DAs categorised as ignored earlier) (2005–2021).
Figure 22. Development hot and cold spots by year, excluding minor DAs (DAs categorised as ignored earlier) (2005-2021).

On the other hand, a large proportion of cold spots are found in the west and centre of the LGA, such as the localities of Glebe, Newtown, Erskineville, Eveleigh and Redfern. A review of the heritage mapping in the LGA shows that these areas coincide with concentration of heritage conservation areas, which tend to have more constraints on development 61.

Total development area in each LEP land use zone was also examined numerically. Half of the zones had DAs lodged for over 70% of the land. The top three zones were B5 Business Development zone (99.6%), B6 Enterprise Corridor zone (85.6%) and RE1 Public Recreation zone (84.9%). Both B5 and B6 are small zones so the high percentages are not surprising. RE1 has large areas across Sydney, and they have seen lots of development probably due to the government emphasis in providing more and better public spaces. It is worth noting that both R1, the General Residential zone and R2, the Low Density Residential are at the bottom of the list, with around 25% and 35% of the zone developed respectively. A review of such zones shows that they are largely occupied by small lot houses and are mostly cold spots in the DA location analysis above.

DA Estimated Value

Given that the numbers of DAs are similar across the years, attention is then paid to the estimated value of newly proposed projects to better examine the magnitude of DAs overtime. Figure 24 shows 2015 saw the biggest total investment in DAs, after which, while values fluctuate, a general declining trend is observed. The median development cost gradually increased from under AUD 20,000 in 2005 to around AUD 50,000 in 2012, then accelerated until 2015, and continues increasing, but at a much slower rate to 2021 (Figure 25). Most projects are around AUD 130,000 as of 2021. Figure 26 highlights the substantial gap between average and median, meaning there has always been some major over the last 5 years, as demonstrated by the drop in average estimated cost.

Figure 24. Total estimated cost of determined DAs by lodgement year (2005–2021).
Figure 25. Median estimated cost of determined DAs by lodgement year (2005–2021).
Figure 26. Average compared to median estimated cost of determined DAs lodged between 2005-2021.

Investment Hot and Cold Spots

Hot and cold spots in terms of estimated project value indicate areas with larger or smaller amounts of capital investments for proposed developments. Figure 27 reveals a belt of such cold spots in the west and middle of the LGA, which is consistent with the mapping of DA lodgement cold spots earlier, but much larger in extent. The hotspots are in similar locations to the DA lodgement ones but less intense, mainly clustering around the CBD and Zetland areas. Detailed yearly review in Figure 28 further illustrates how the CBD is the only location attracting major projects throughout the study period.

Figure 27. Estimated cost hot and cold spots across all years (2005-2021).
Figure 28. Estimated cost hot and cold spots by year (2005–2021).

The uneven distribution of development spendings between suburbs is more closely examined in Figure 29. The Sydney CBD area has undoubtedly seen the largest amount of DA investments across the study period. In some years, such as 2006, 2007, 2017 and 2018, its total estimated cost is over 50% of that of the whole LGA. Zetland is near the top from 2005 onwards, but gradually makes way for other suburbs such as Alexandria, falling to fourth place in 2020. Other suburbs such as Rosebery, Haymarket and Waterloo are mostly in the second tier, occasionally having a spike in values.

Figure 29. Total estimated cost by suburb by year (2005–2021).
Figure 30. Quintile distribution of median DA estimated cost by suburb by year (2005–2021).

The above suburbs are in the lead in terms of total estimated cost mostly due to concentration of high value projects. When it comes to the more common scenario, the mapping of median values in Figure 30 clearly shows that none of the suburbs are constantly in the lead.

Approved DA Usage

This section of the study will focus on DAs where a proposed use can be identified, as explained in Section 3.4.5. Only approved DAs will be examined as they form most of the dataset and have the highest chance of realization.

Over the years, the biggest portion of the above DAs fall within the retail category, followed closely by commercial and residential (Figure 31). The next two categories are utilities and community, after which other categories fall under 5% of total applications.

These top five categories also tend to be on the top in the yearly reviews (Figure 32), with retail clearly in the lead, followed by commercial between 2005–2011, and then residential since 2012.

Figure 31. Use distribution of approved DAs where a proposed use can be identified (2004–2022).
Figure 32. Number of DAs by proposed uses by year (2005-2021).

When reviewed with Figure 33, it shows that retail, residential, utilities, visitors accommodation and mixed use tend to have relatively smaller areas per project as compared to commercial, community, education, entertainment and health uses.

A closer look was taken into three use categories of interest: commercial, retail and residential. It can be observed that the number of approved DAs in each category remained relatively consistent over time (Figure 34) but both the total (Figure 35) and the average estimated cost (Figure 36) increased over the years. Spot check of values showed that the increase is generally above inflation rates, meaning projects in all three categories are getting more expensive. It is unsurprising that although retail had the highest numbers, the average costs are mostly below the other two categories, as retail proposals tend to be small scale developments such as new shops and restaurants.

Figure 33. Proposed usage by total area of DAs (2004–2022).
Figure 34. Number of approved DAs by proposed uses over time (2005–2021).
Figure 35. Total estimated cost of approved DAs by proposed uses over time (2005-2021).
Figure 36. Average estimated cost of approved DAs by proposed uses over time (2005-2021).

Mapping the locations of the above three categories of DAs (Figure 37) shows the different spatial distribution of these uses. Retail and commercial uses are concentrated around similar areas such as the CBD, Alexandria and Zetland, while residential proposals are more dispersed throughout, except for areas such as the CBD, Camperdown, Eveleigh and Alexandria. Retail and commercial uses also show clustering in linear patterns, likely to be along major road corridors.

Figure 37. Mapping of selected DA locations (marked in yellow) across the study period (2004-2022): (Left) DAs identified as for retail use (Centre) DAs identified as for commercial use (Right) DAs identified as for residential use.

DA Assessment Time

Assessment time is another important aspect of DAs. It provides an indication of how reflective the DAs are to changing urban conditions.

Figure 38 shows that overall, a good proportion of DAs (48%) were determined between one and three months after lodging. Generally, around 76% of DAs reached a decision within a 3-month timeframe, and most DAs (94%) were determined within half a year of lodging. The above observed pattern is also relatively consistent on a yearly basis, indicating there is no direct correlation between total number of DAs to be processed and assessment time (Figure 39). The average is always higher than the median (Figure 40), meaning the dataset distribution is positively skewed, whereas most assessment times in the dataset are lower than the average. This is consistent with the earlier findings. Both average and median assessment times oscillate within a small range from 2004 to 2014, before a sharp increase in 2015 (Figure 40). The average and median values seemed to decline since then but still fluctuate to the present. An apparent drop after 2021 is due to incomplete data in 2022.

Figure 38. Distribution of DA assessment time (2004–2022).
Figure 39. Assessment time distribution per year (2005–2021).
Figure 40. Average and median assessment time for all determined DAs by month (2004–2022).

Assessment time is then reviewed by type of determination (Figure 41) to assess possible correlations. As the court process is not managed by Council, court-related entries are removed from this analysis to better understand CoS assessment times. As ‘Deferred Commencement Activated’ is the follow up phase of ‘Deferred Commencement’, they are combined for the purpose of this analysis. Figure 42 dives into the three remaining categories and demonstrates that DAs approved with conditions tend to be the fastest, mostly around 50 days. This is followed by refusals at around 80 days. Deferred commencement projects take double the time or more with a less predictable timeframe. This is consistent with practical experience, where Council and applicant would usually engage in rounds of discussions and modifications to try to resolve issues to get to deferred commencement or before a formal refusal is issued.

Figure 41. Proportion of different types of determination (2004–2022).
Figure 42. Annual median assessment time by decision type (2004-2022).

A review was also done to check if there is any correlation between estimated project cost and assessment time. Figure 43 shows that there is a small increase in assessment time as estimated cost increases.

Figure 43. Estimated cost vs. assessment time for all determined DAs (log scale) (2004-2022): (a) Approved with conditions (each purple dot represents a DA that is approved with conditions)
(b) Deferred commencement (each red dot represents a DA with deferred commencement determination)
(c) Refused (each green dot represents a DA that is refused).

DA Dashboard

All the diagrams and maps from the analysis in this paper are embedded in a publicly accessible website using Plotly Dash. The website can be accessed through the following link: http://datashboard.com (accessed on 1 September 2022).

Discussion

This study aimed to perform a spatiotemporal investigation of the developments in the CoS LGA from 2004 to 2022 to contribute towards filling in the gap of publicly available, comprehensive, data-based spatiotemporal analysis of development patterns in the CoS area. The results have shown several macro-level patterns in recent CoS development.

Development as a Sign of Socioeconomic Activity

Ruming (2009) noted that developments are unevenly distributed in NSW and taking 2005 to 2006 for example, Inner- and Middle-ring Sydney had approximately 1000 DAs per council 21. This is confirmed by the over 2000 entries found in CoS LGA for the same time period, which is double the average.

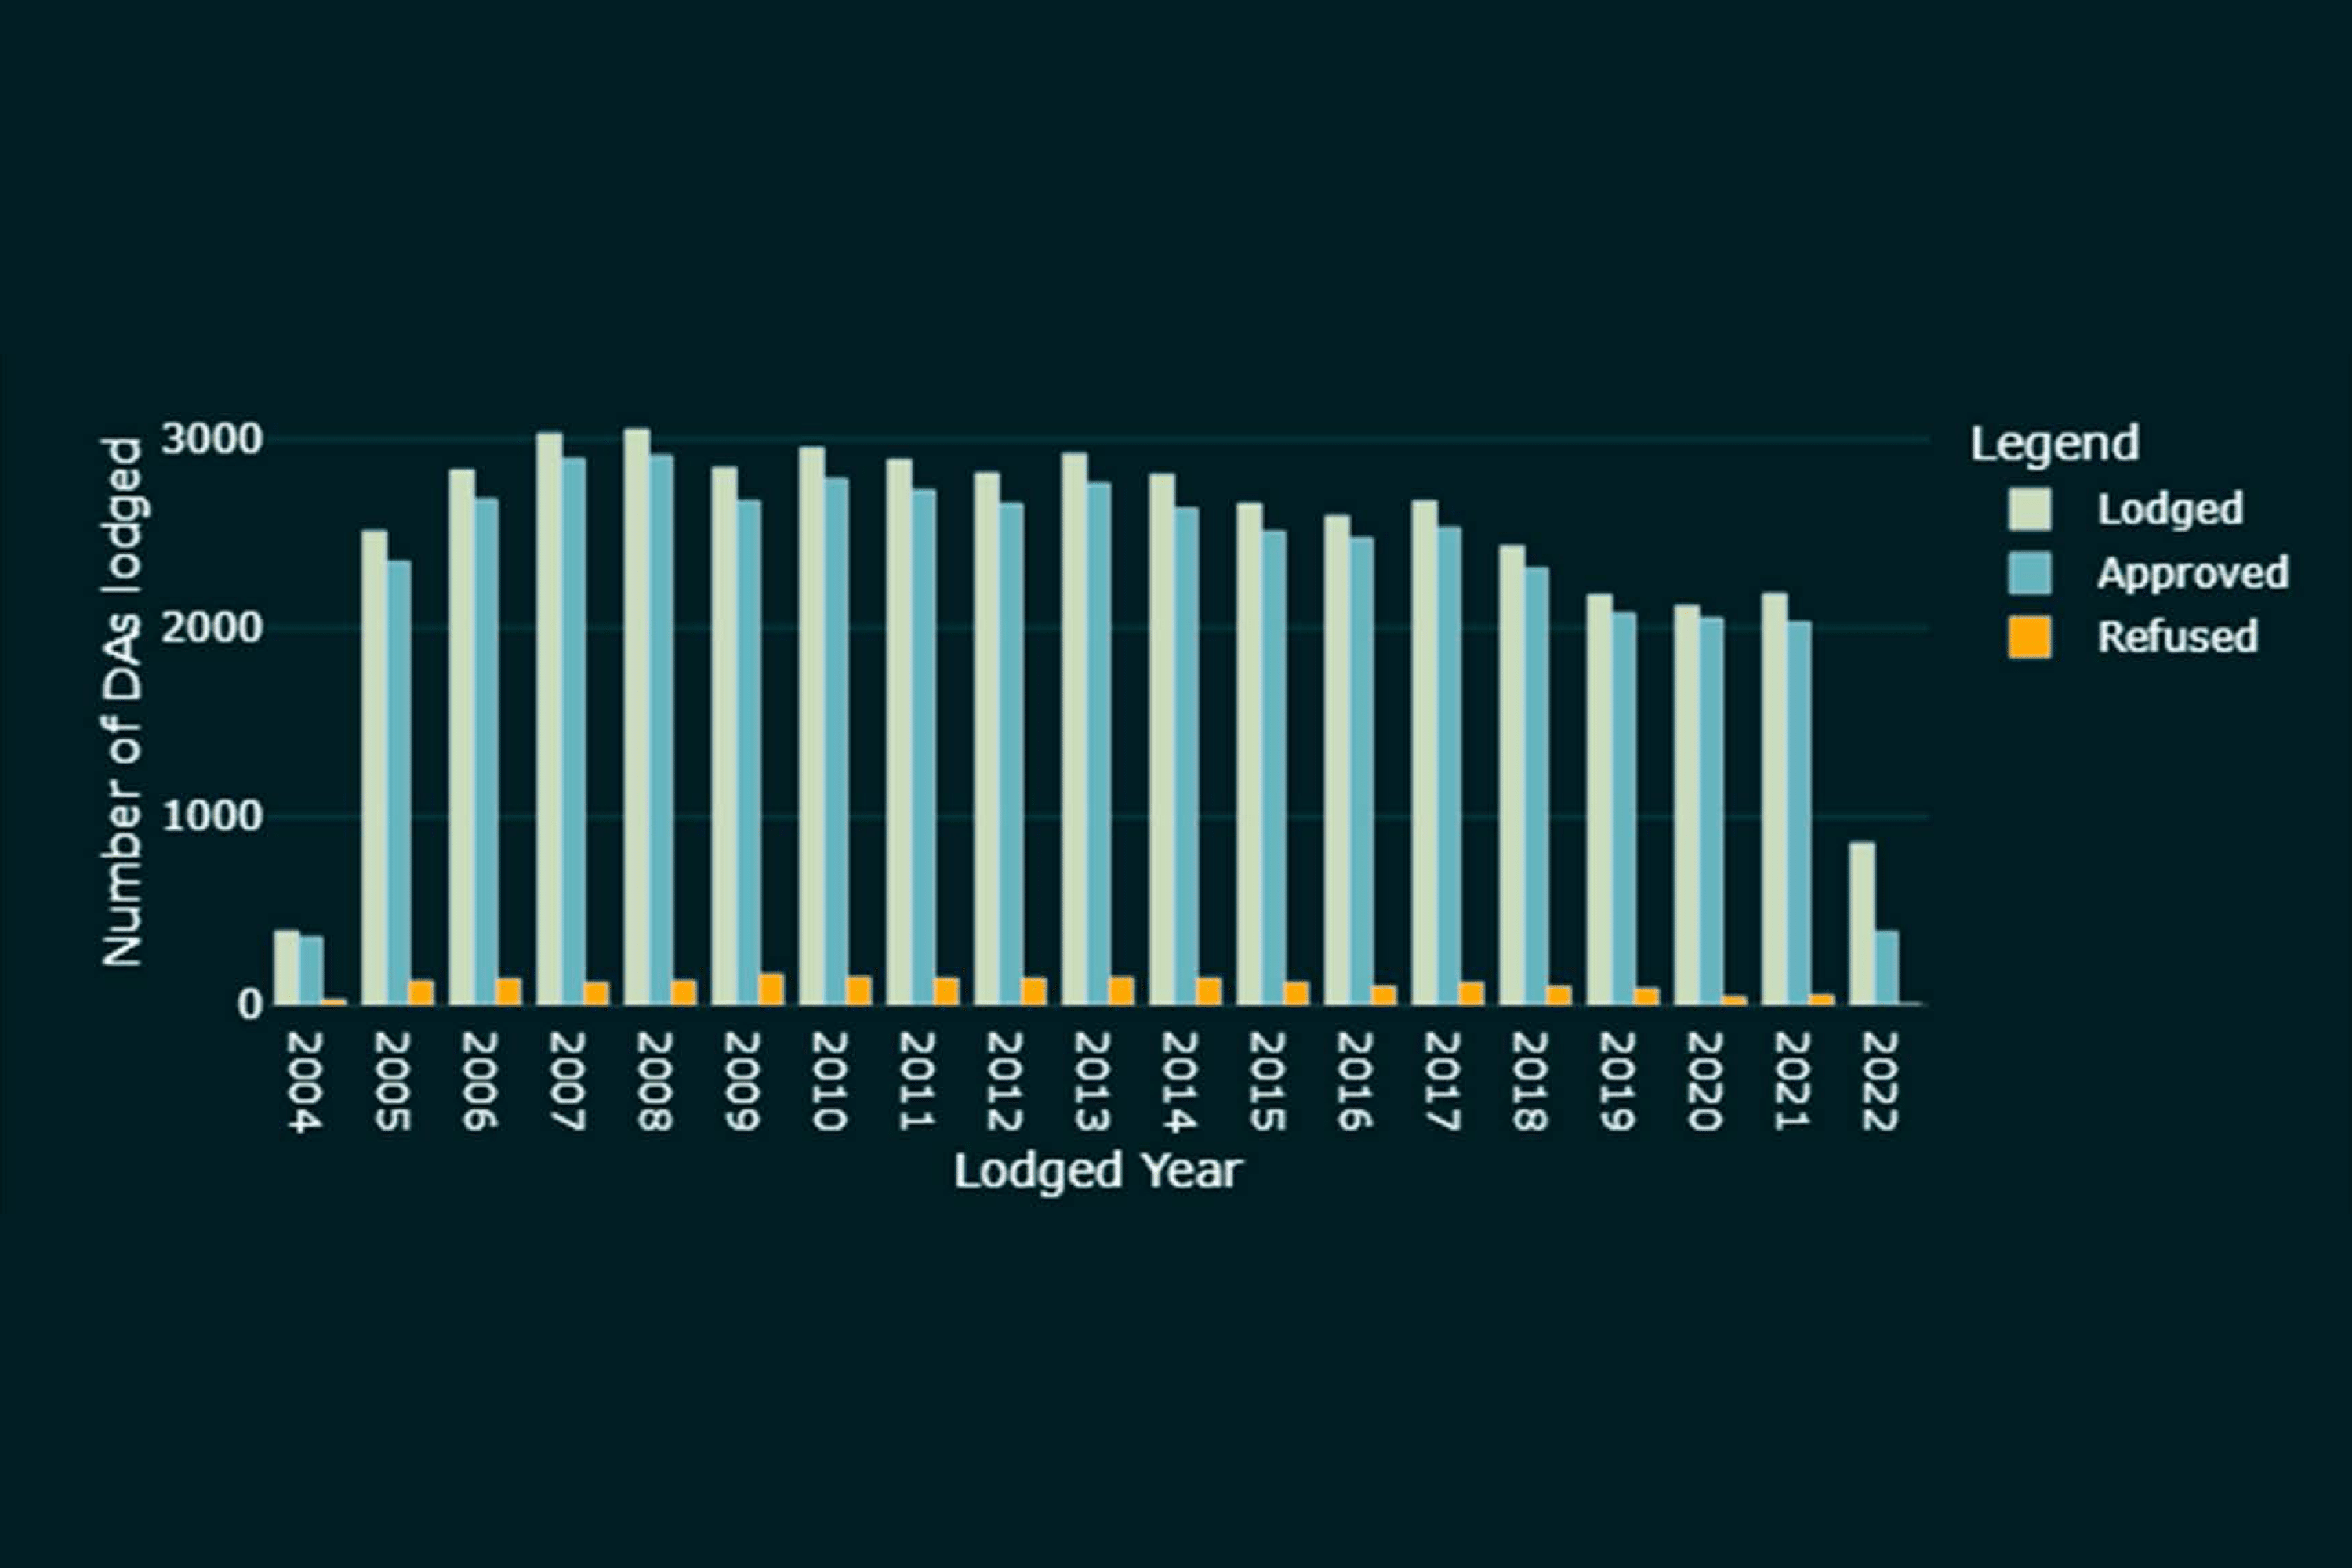
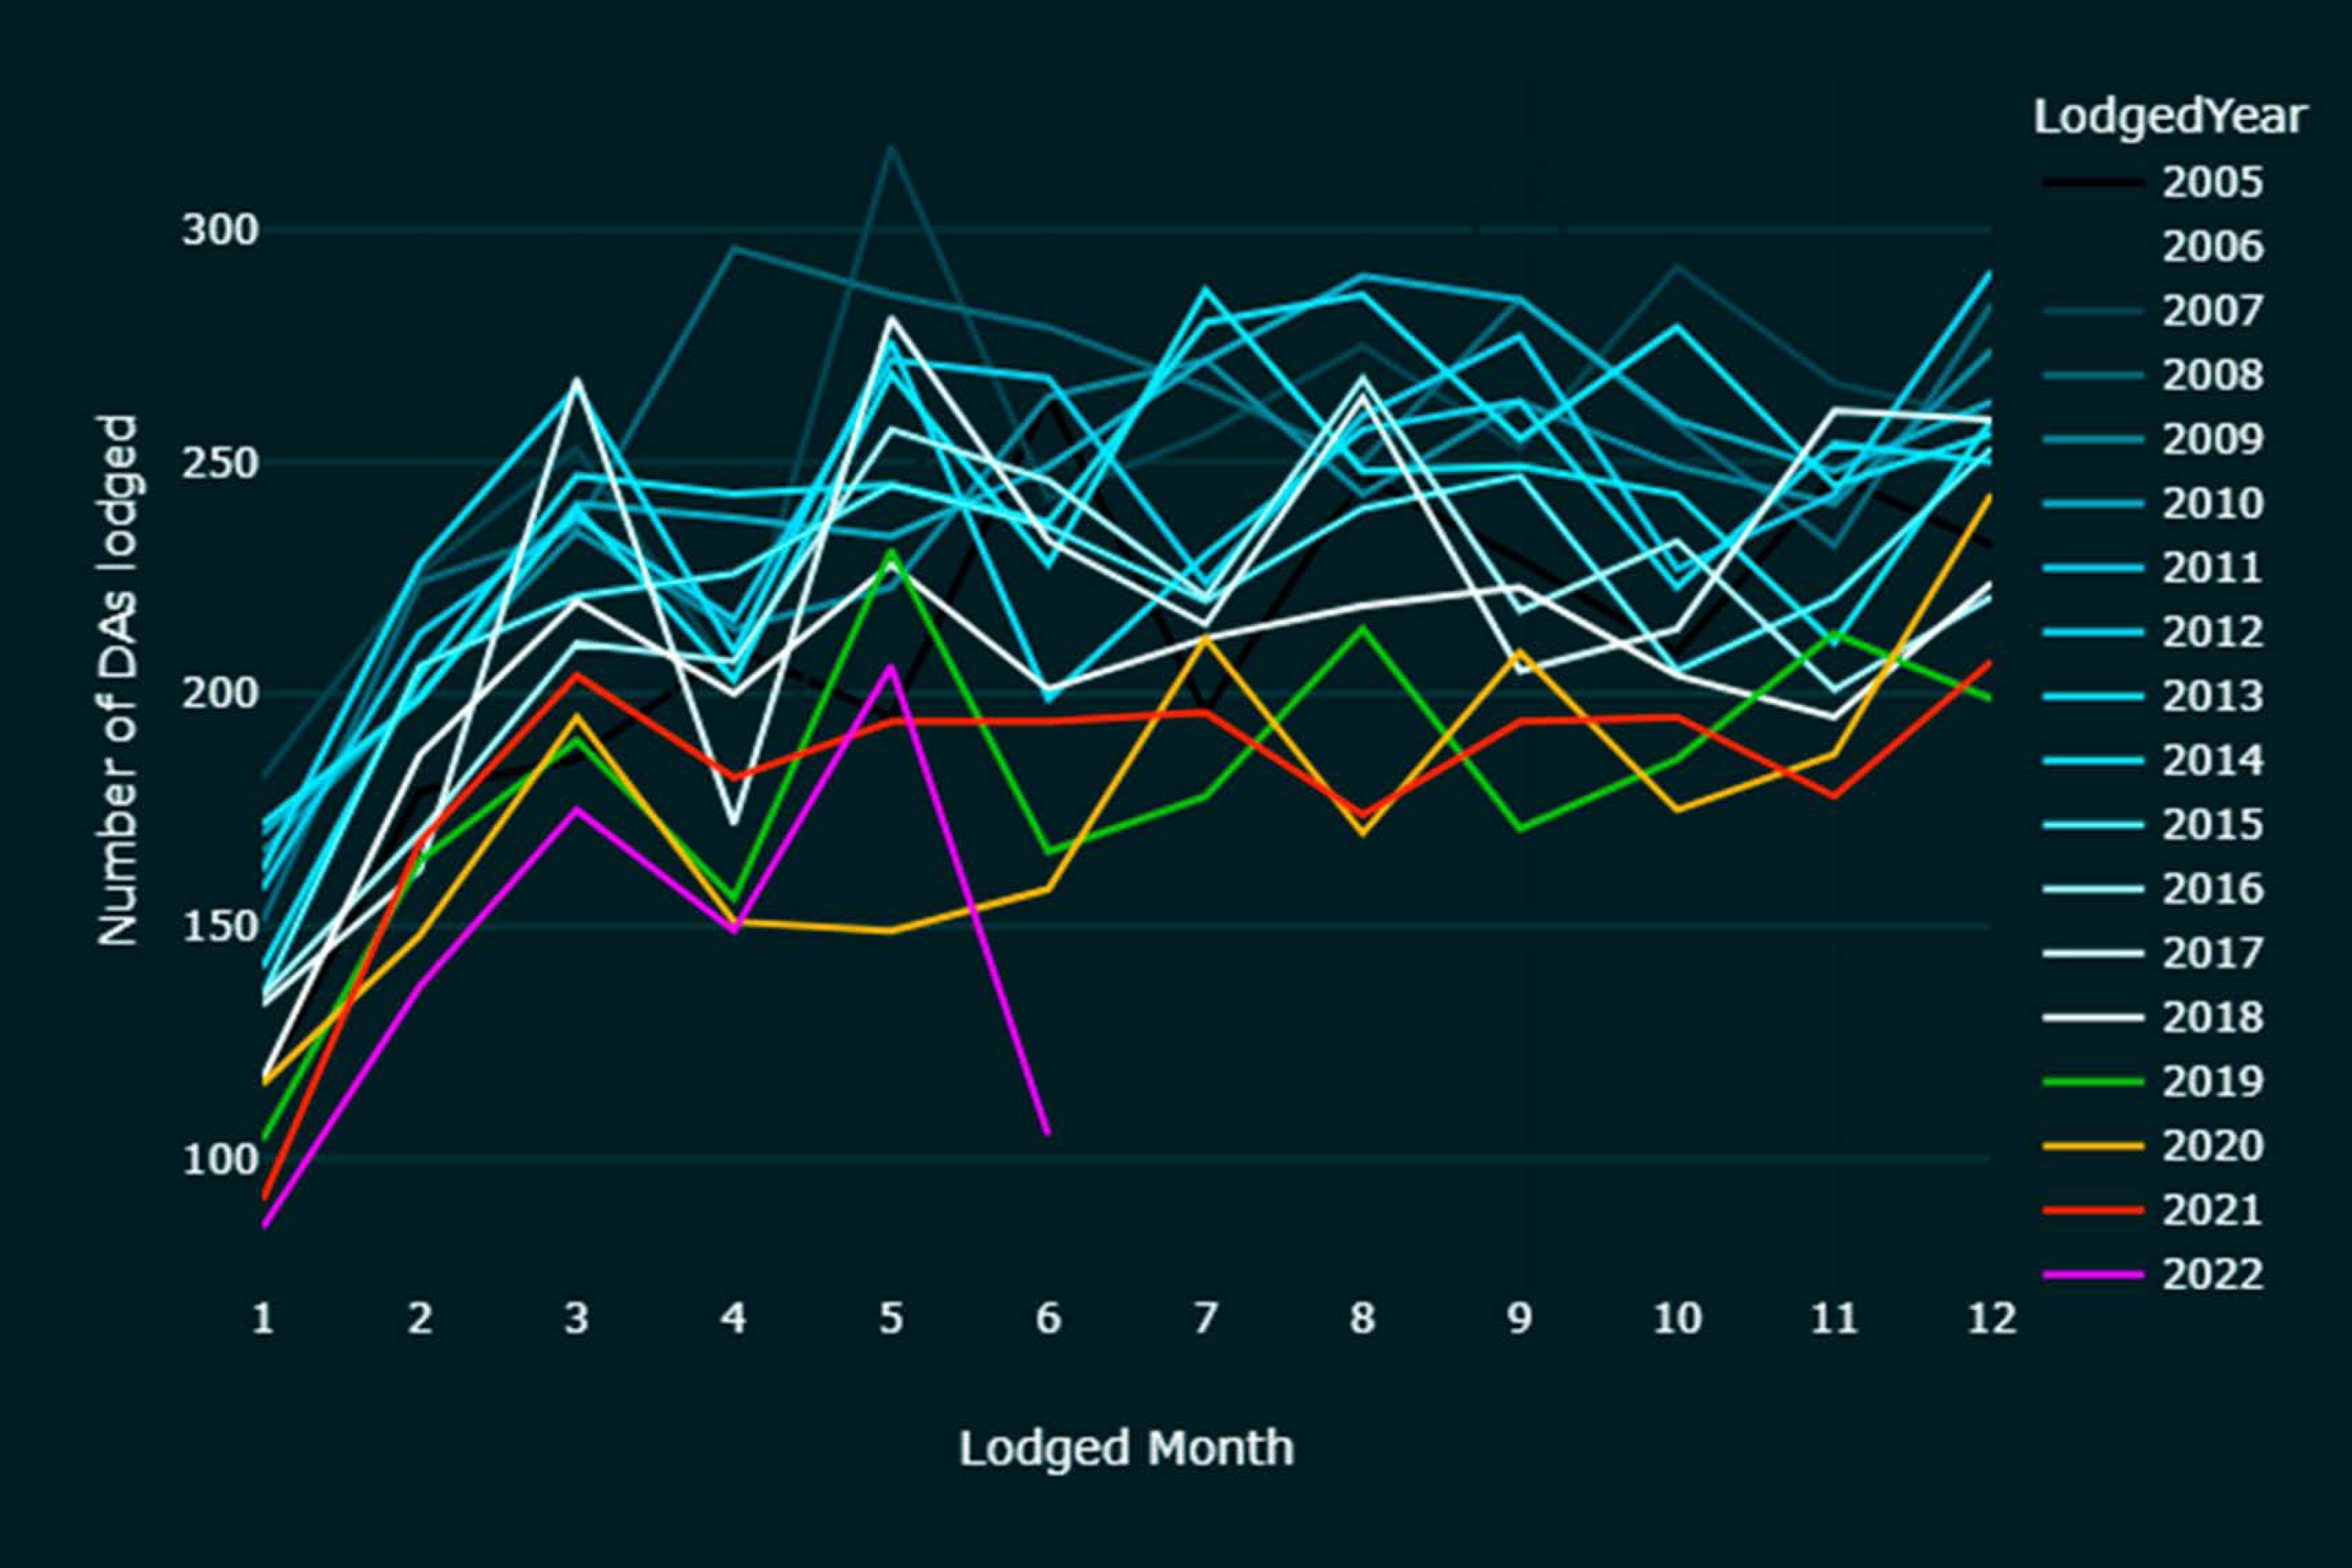
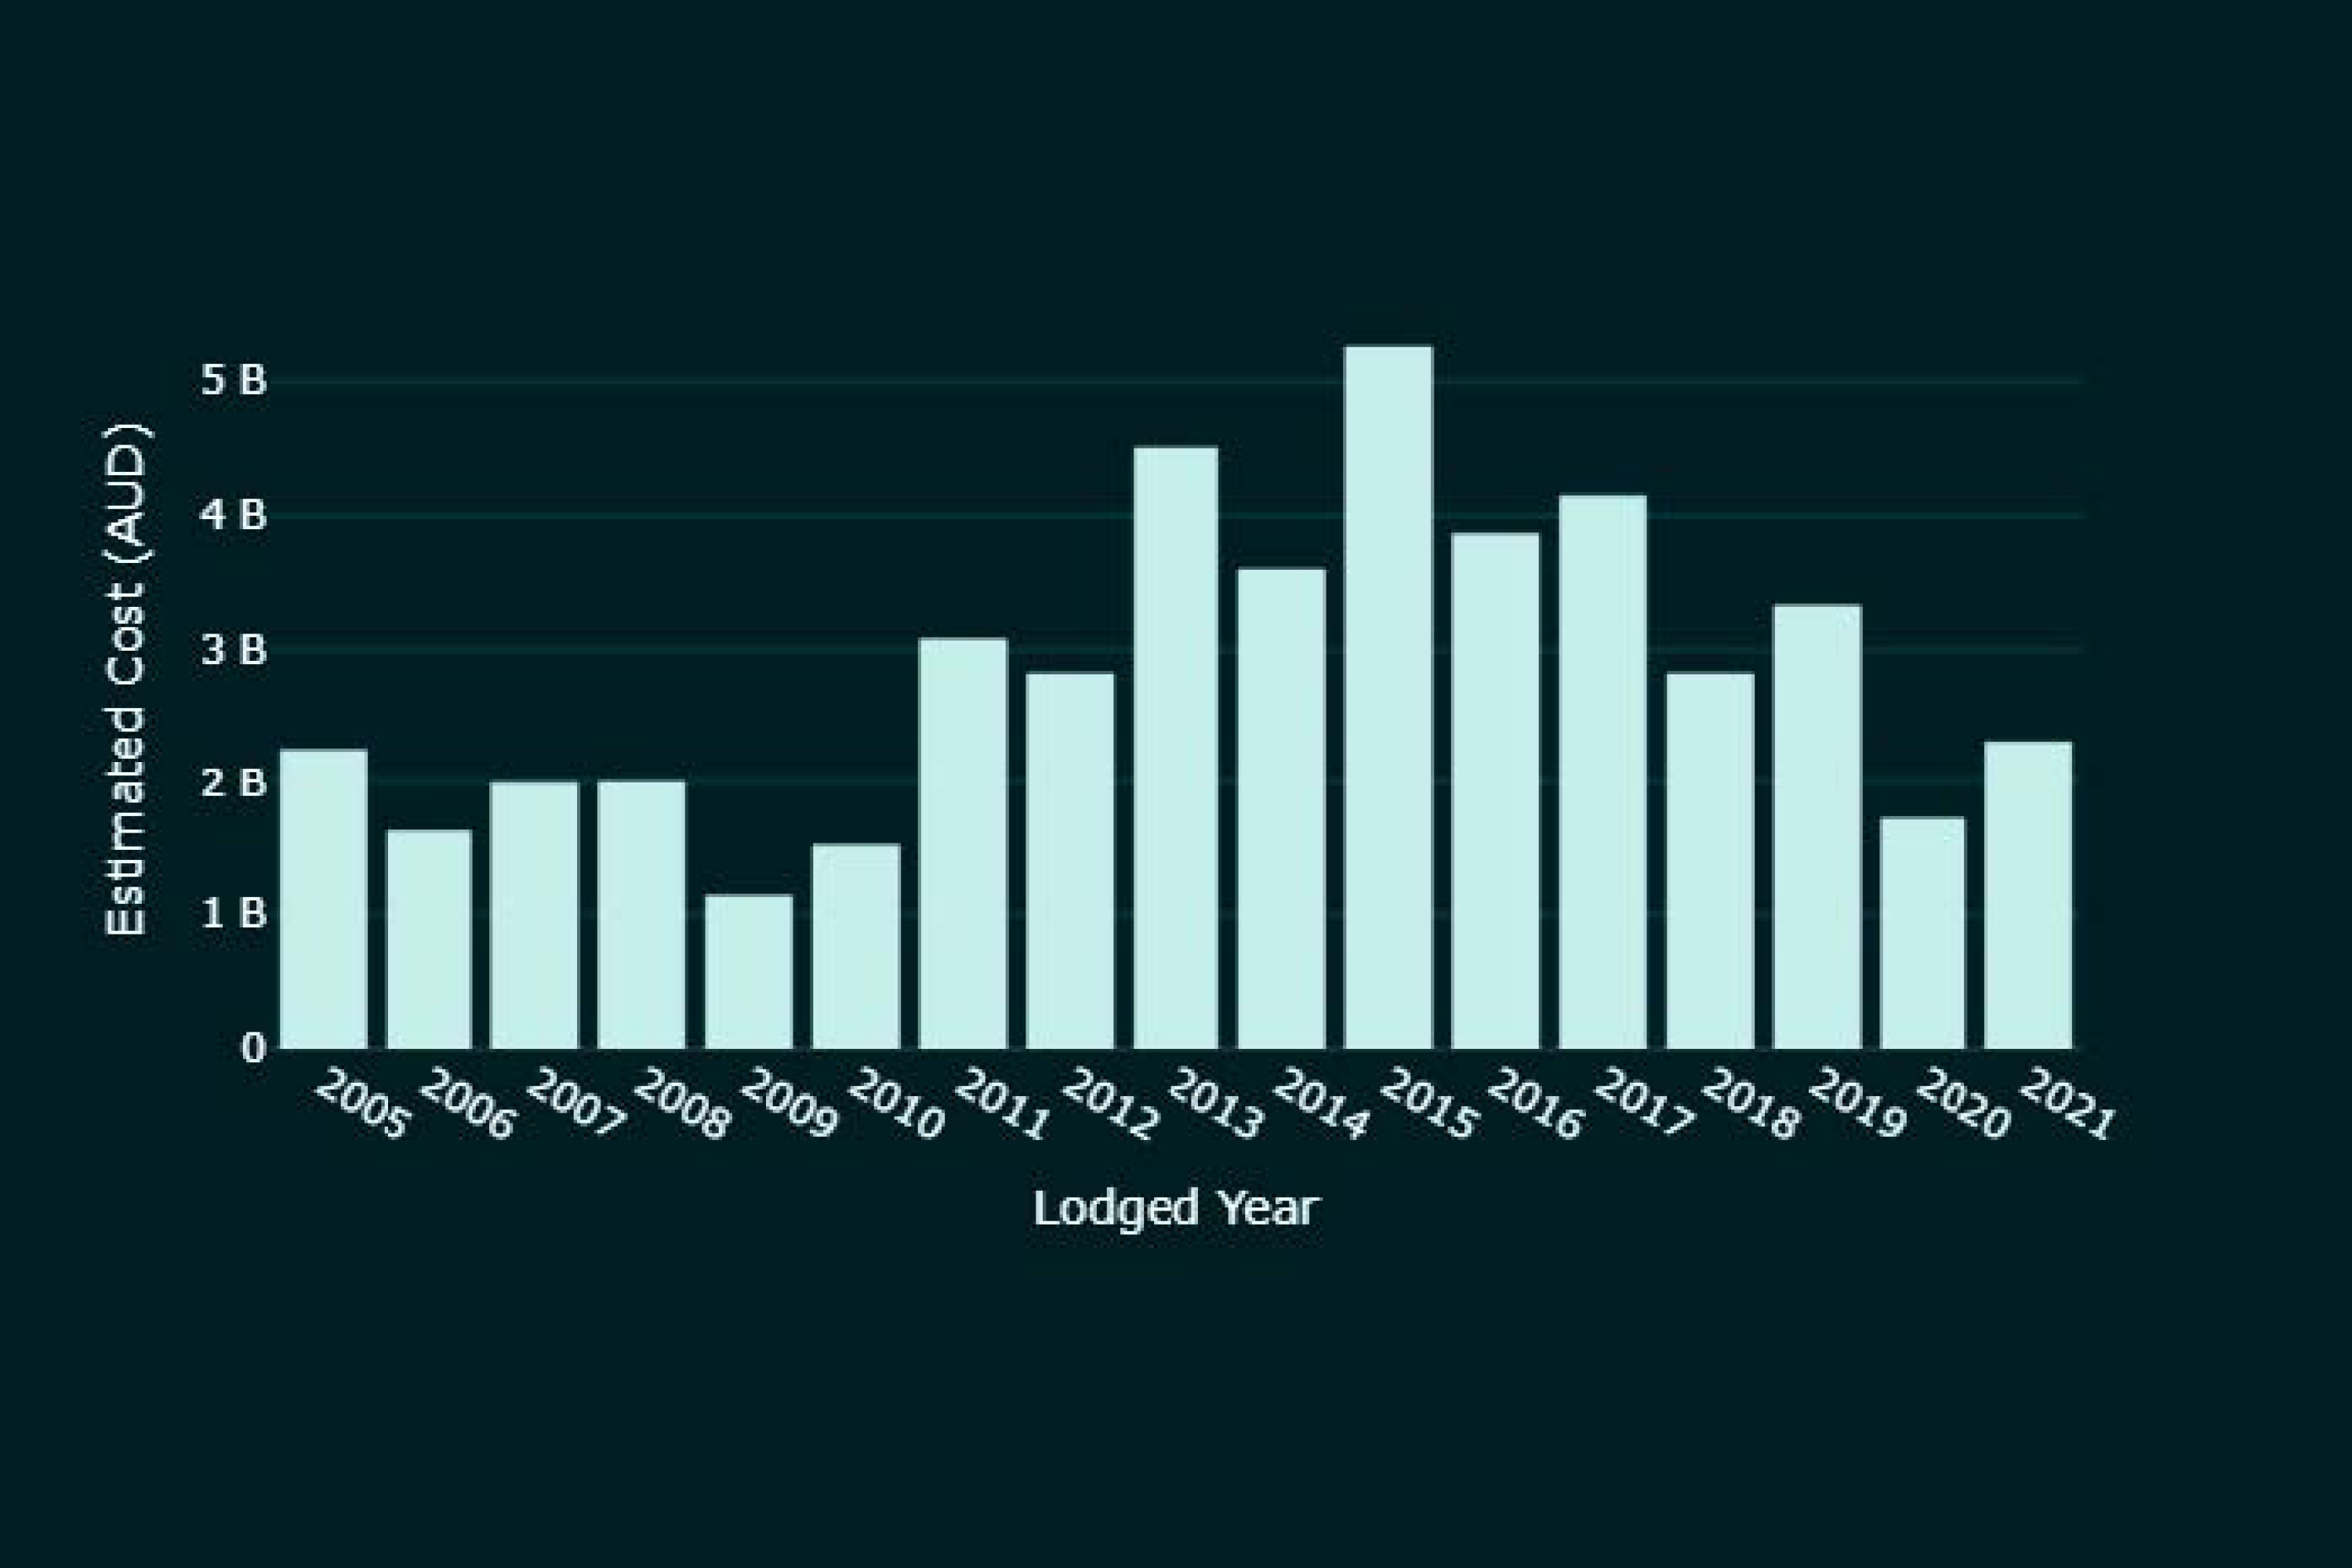
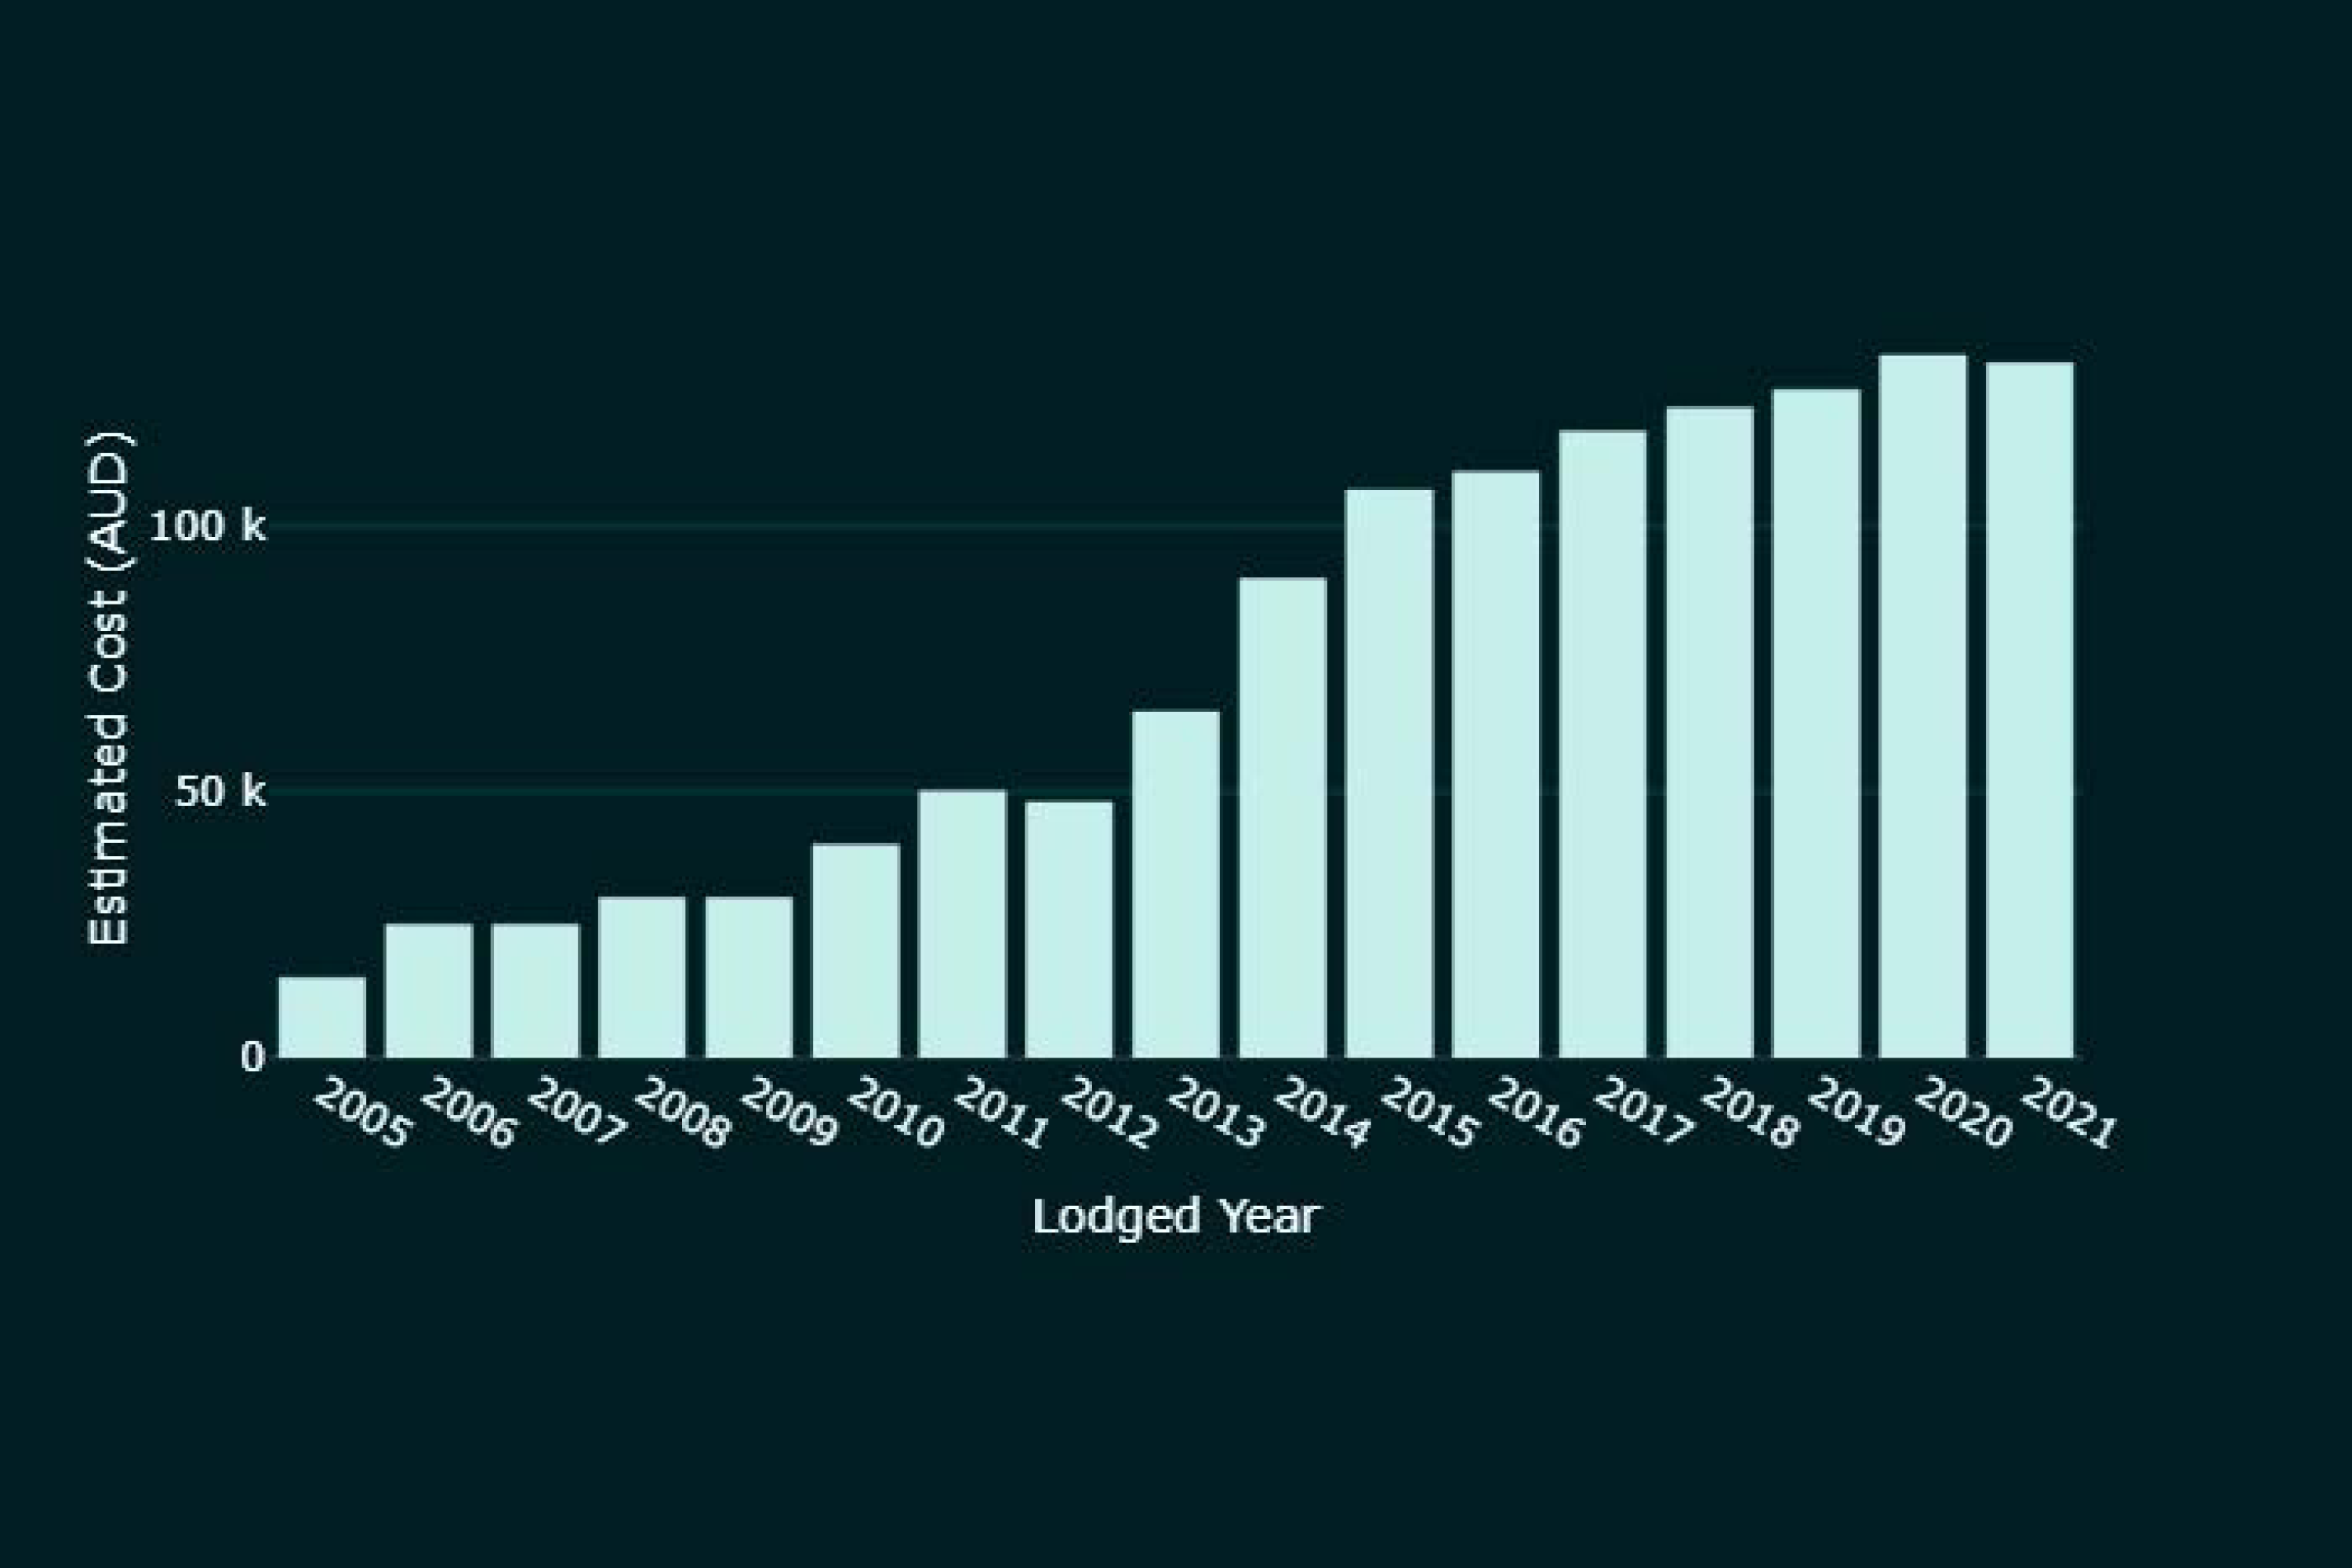
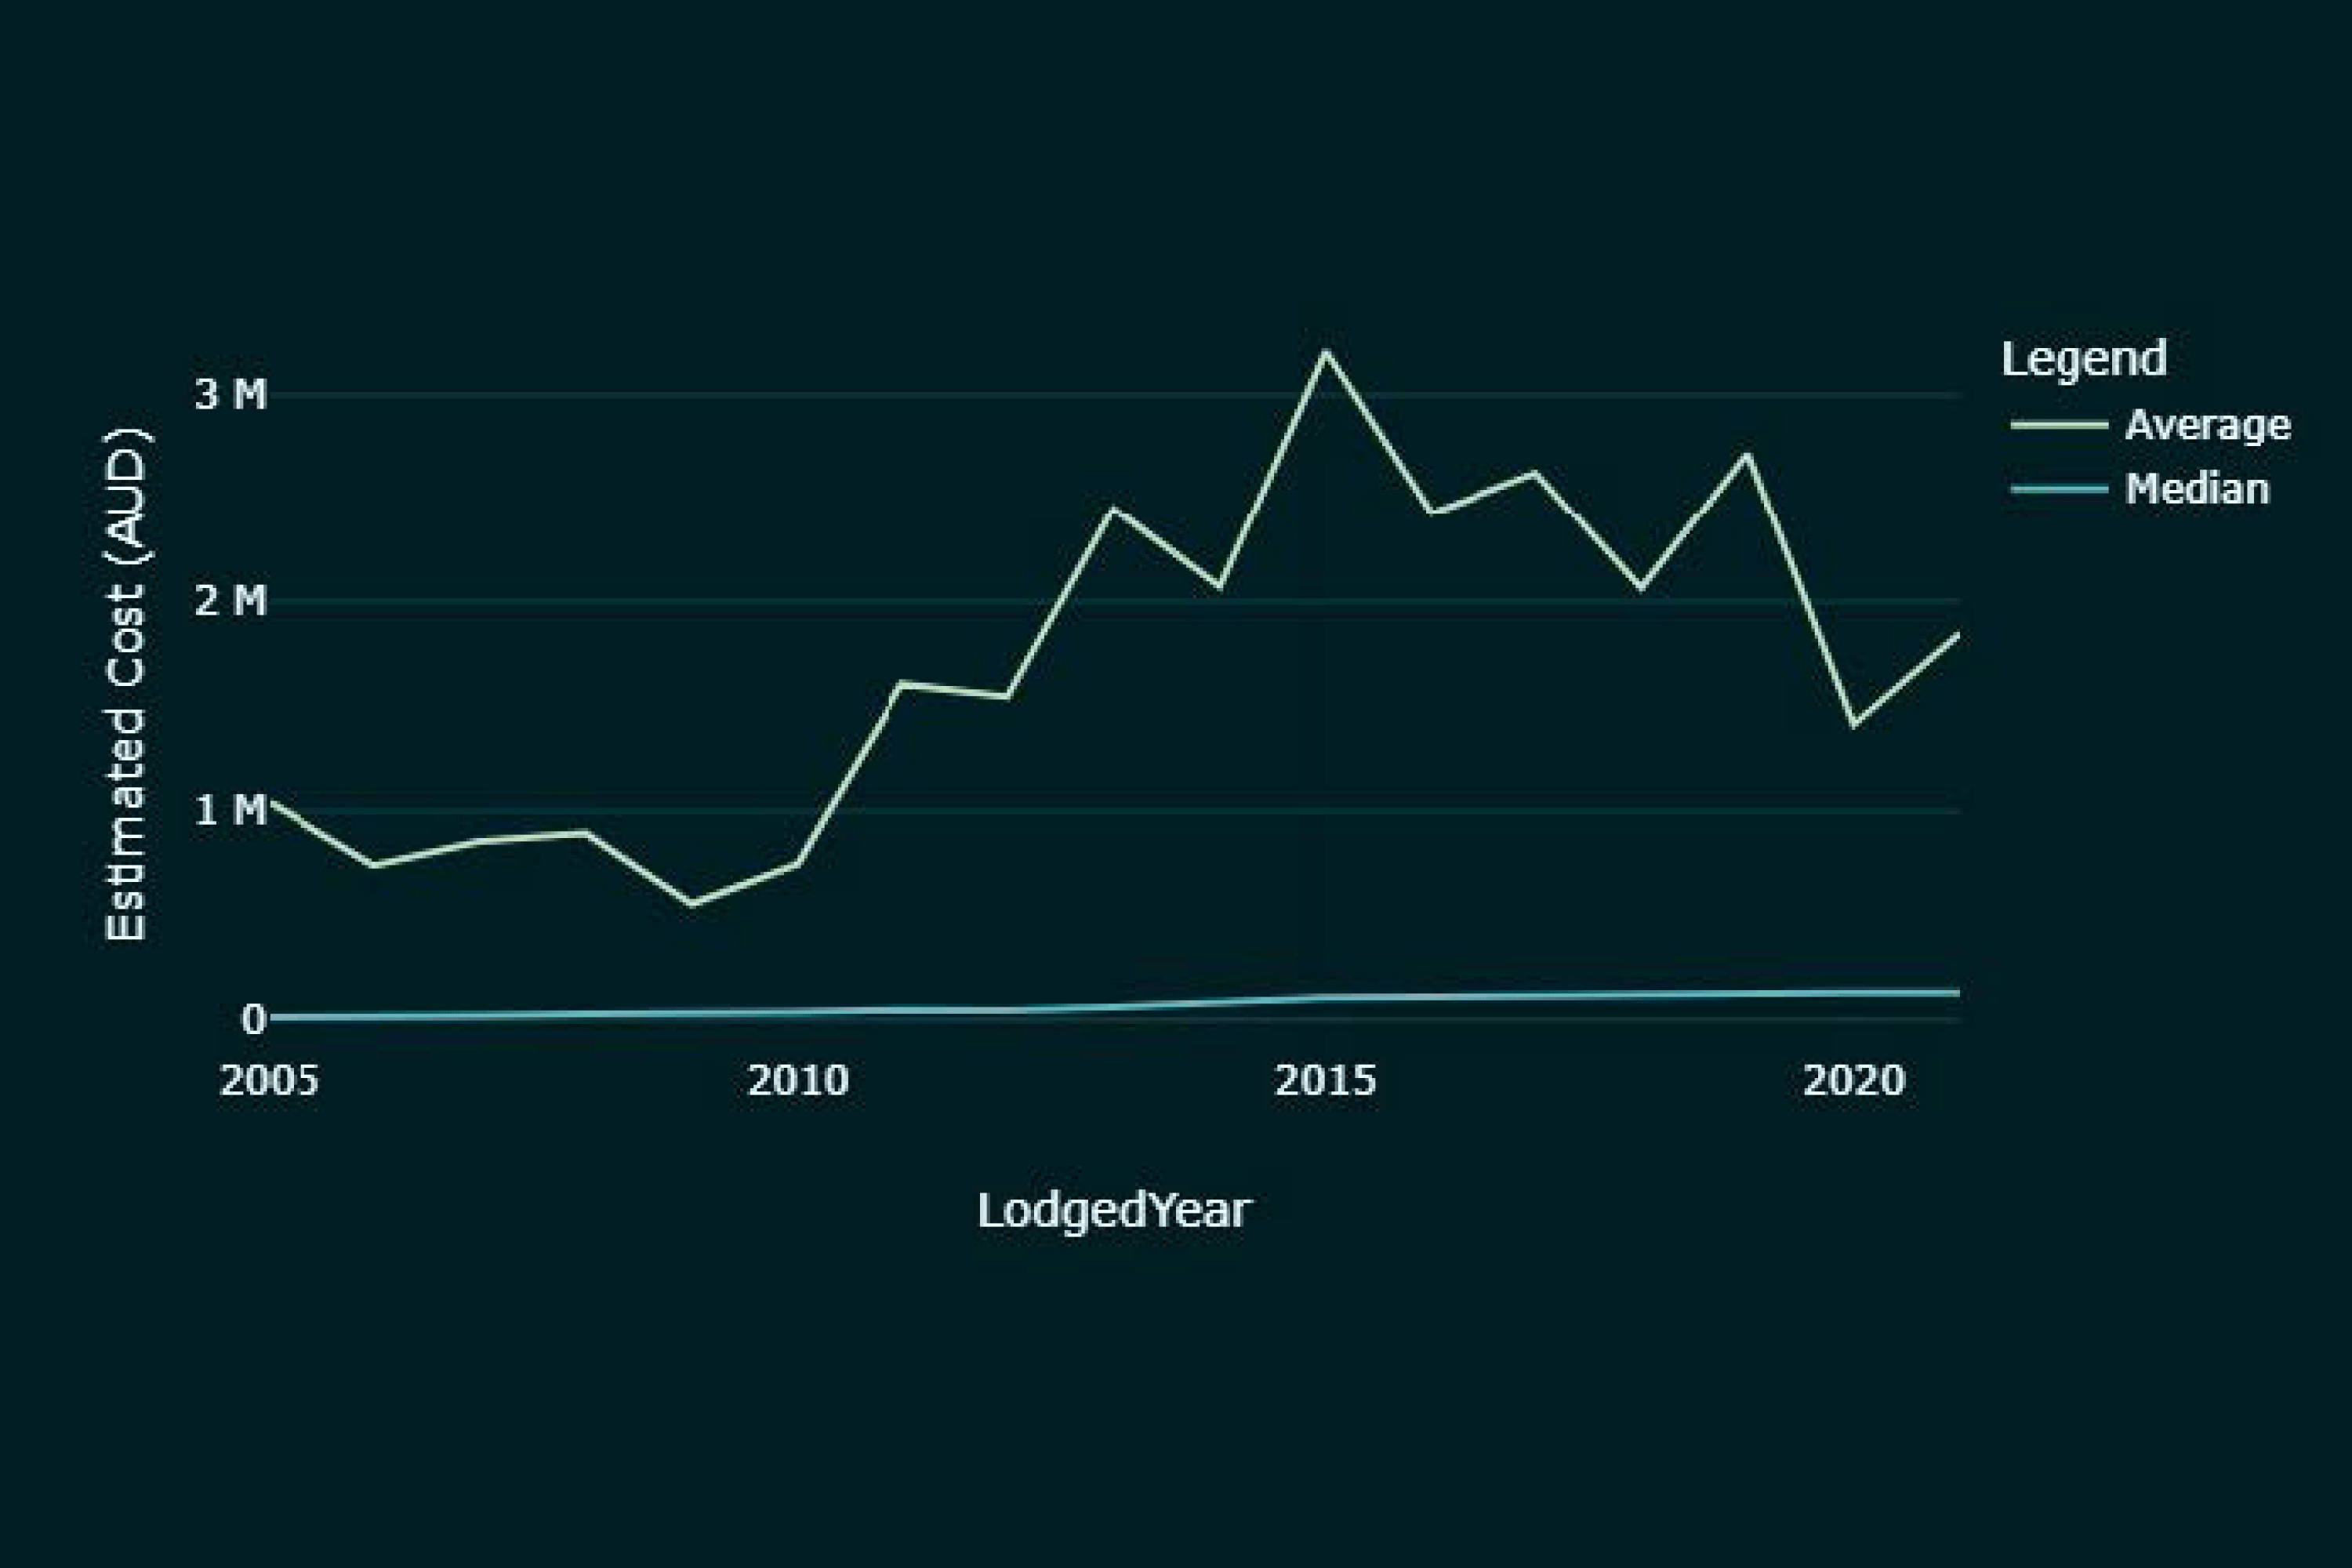
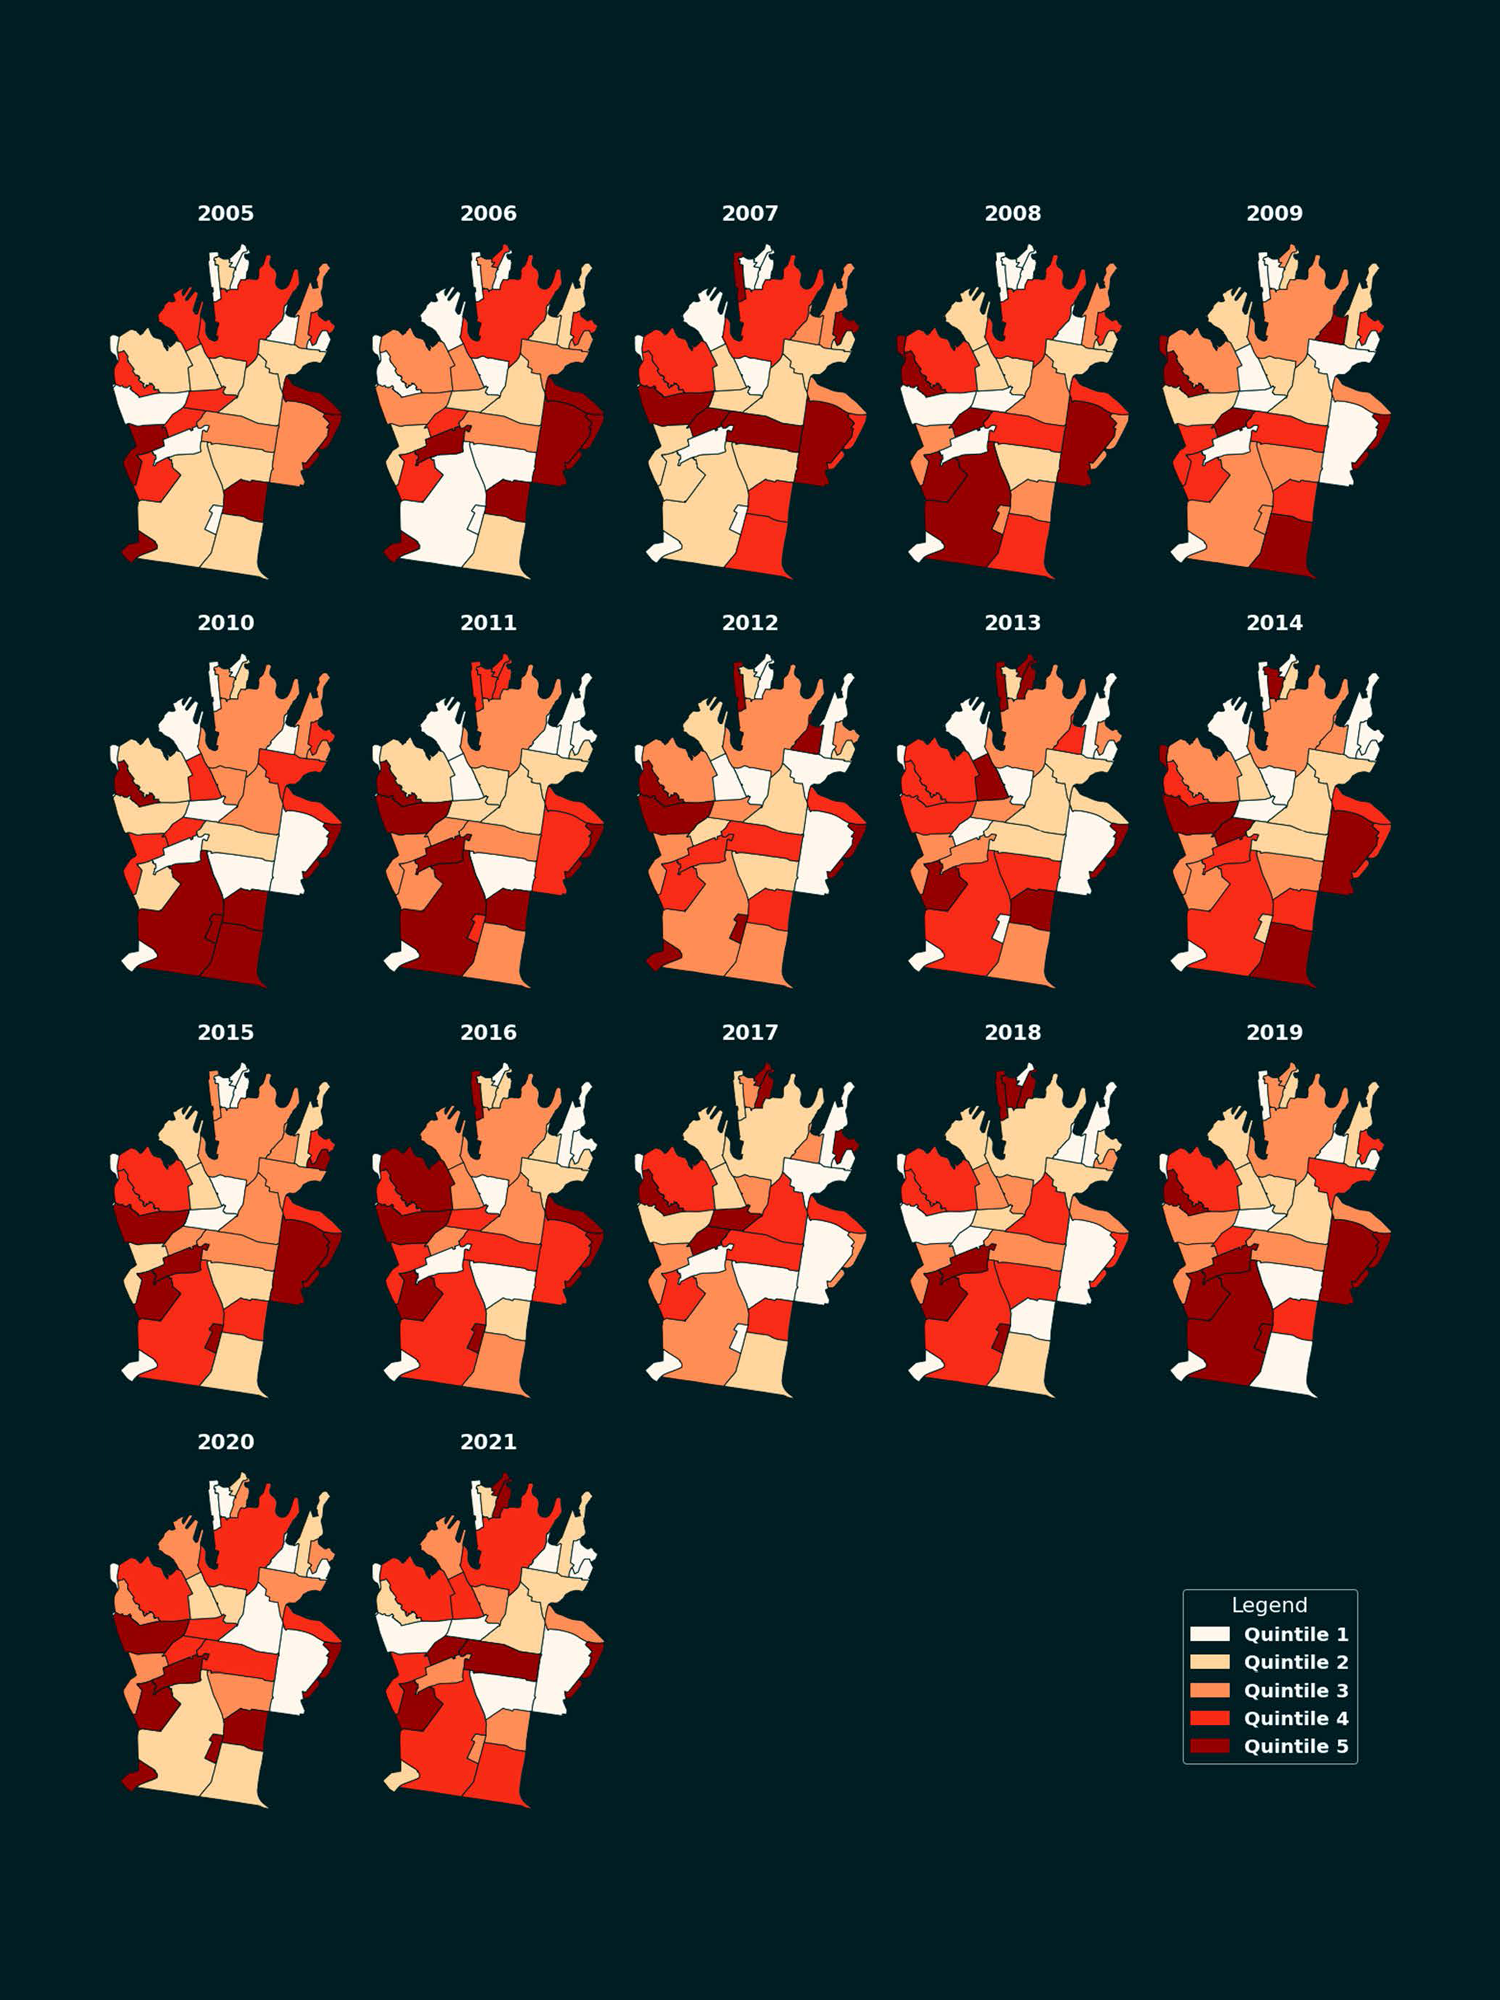
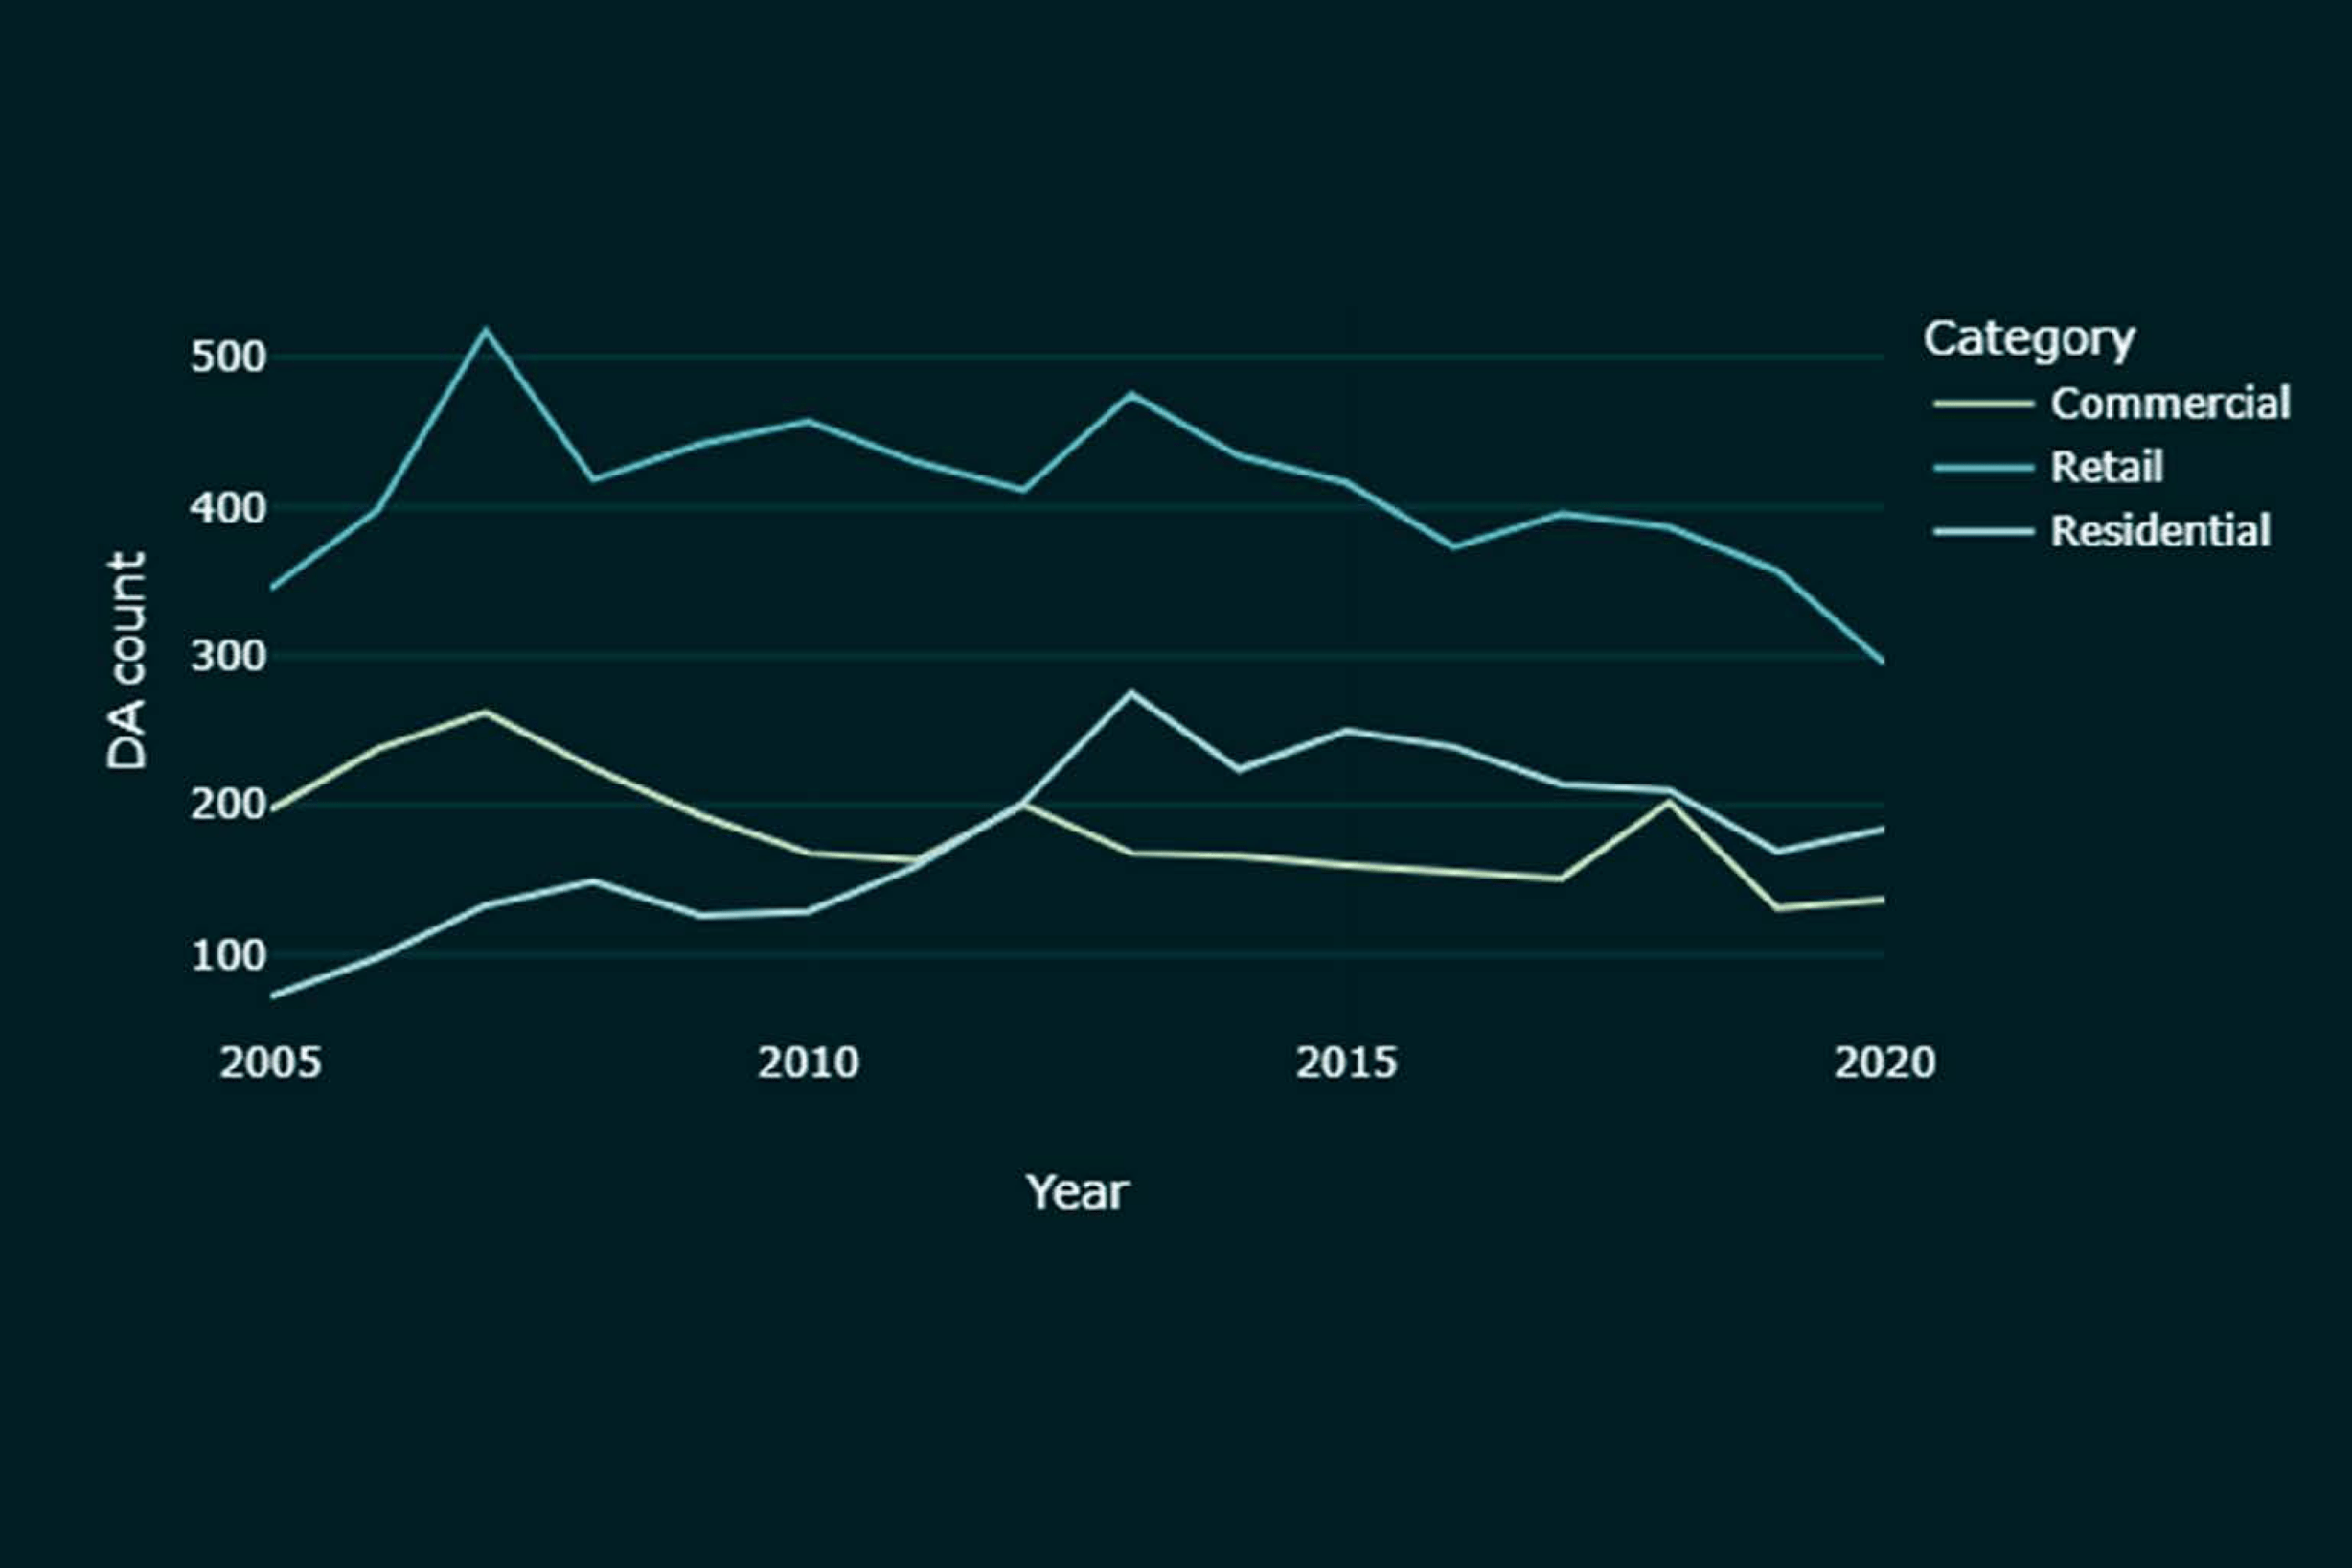
The research found that the number of DAs lodged has fluctuated over the years and followed a downwards trajectory since 2013, stabilizing in the last three years. Despite the shortage of data in 2022, a comparison with the same period in the past years so far shows that 2022 is likely to stay at the lower level in terms of DA lodgement. The analysis of total estimated cost of approved DAs shows a more complex pattern, with higher costs from 2013 to 2017 which may be the reflection of a recent concentration of development into larger, higher-cost projects. This is further reinforced by the steadily increasing median estimated cost of DAs approved each year.

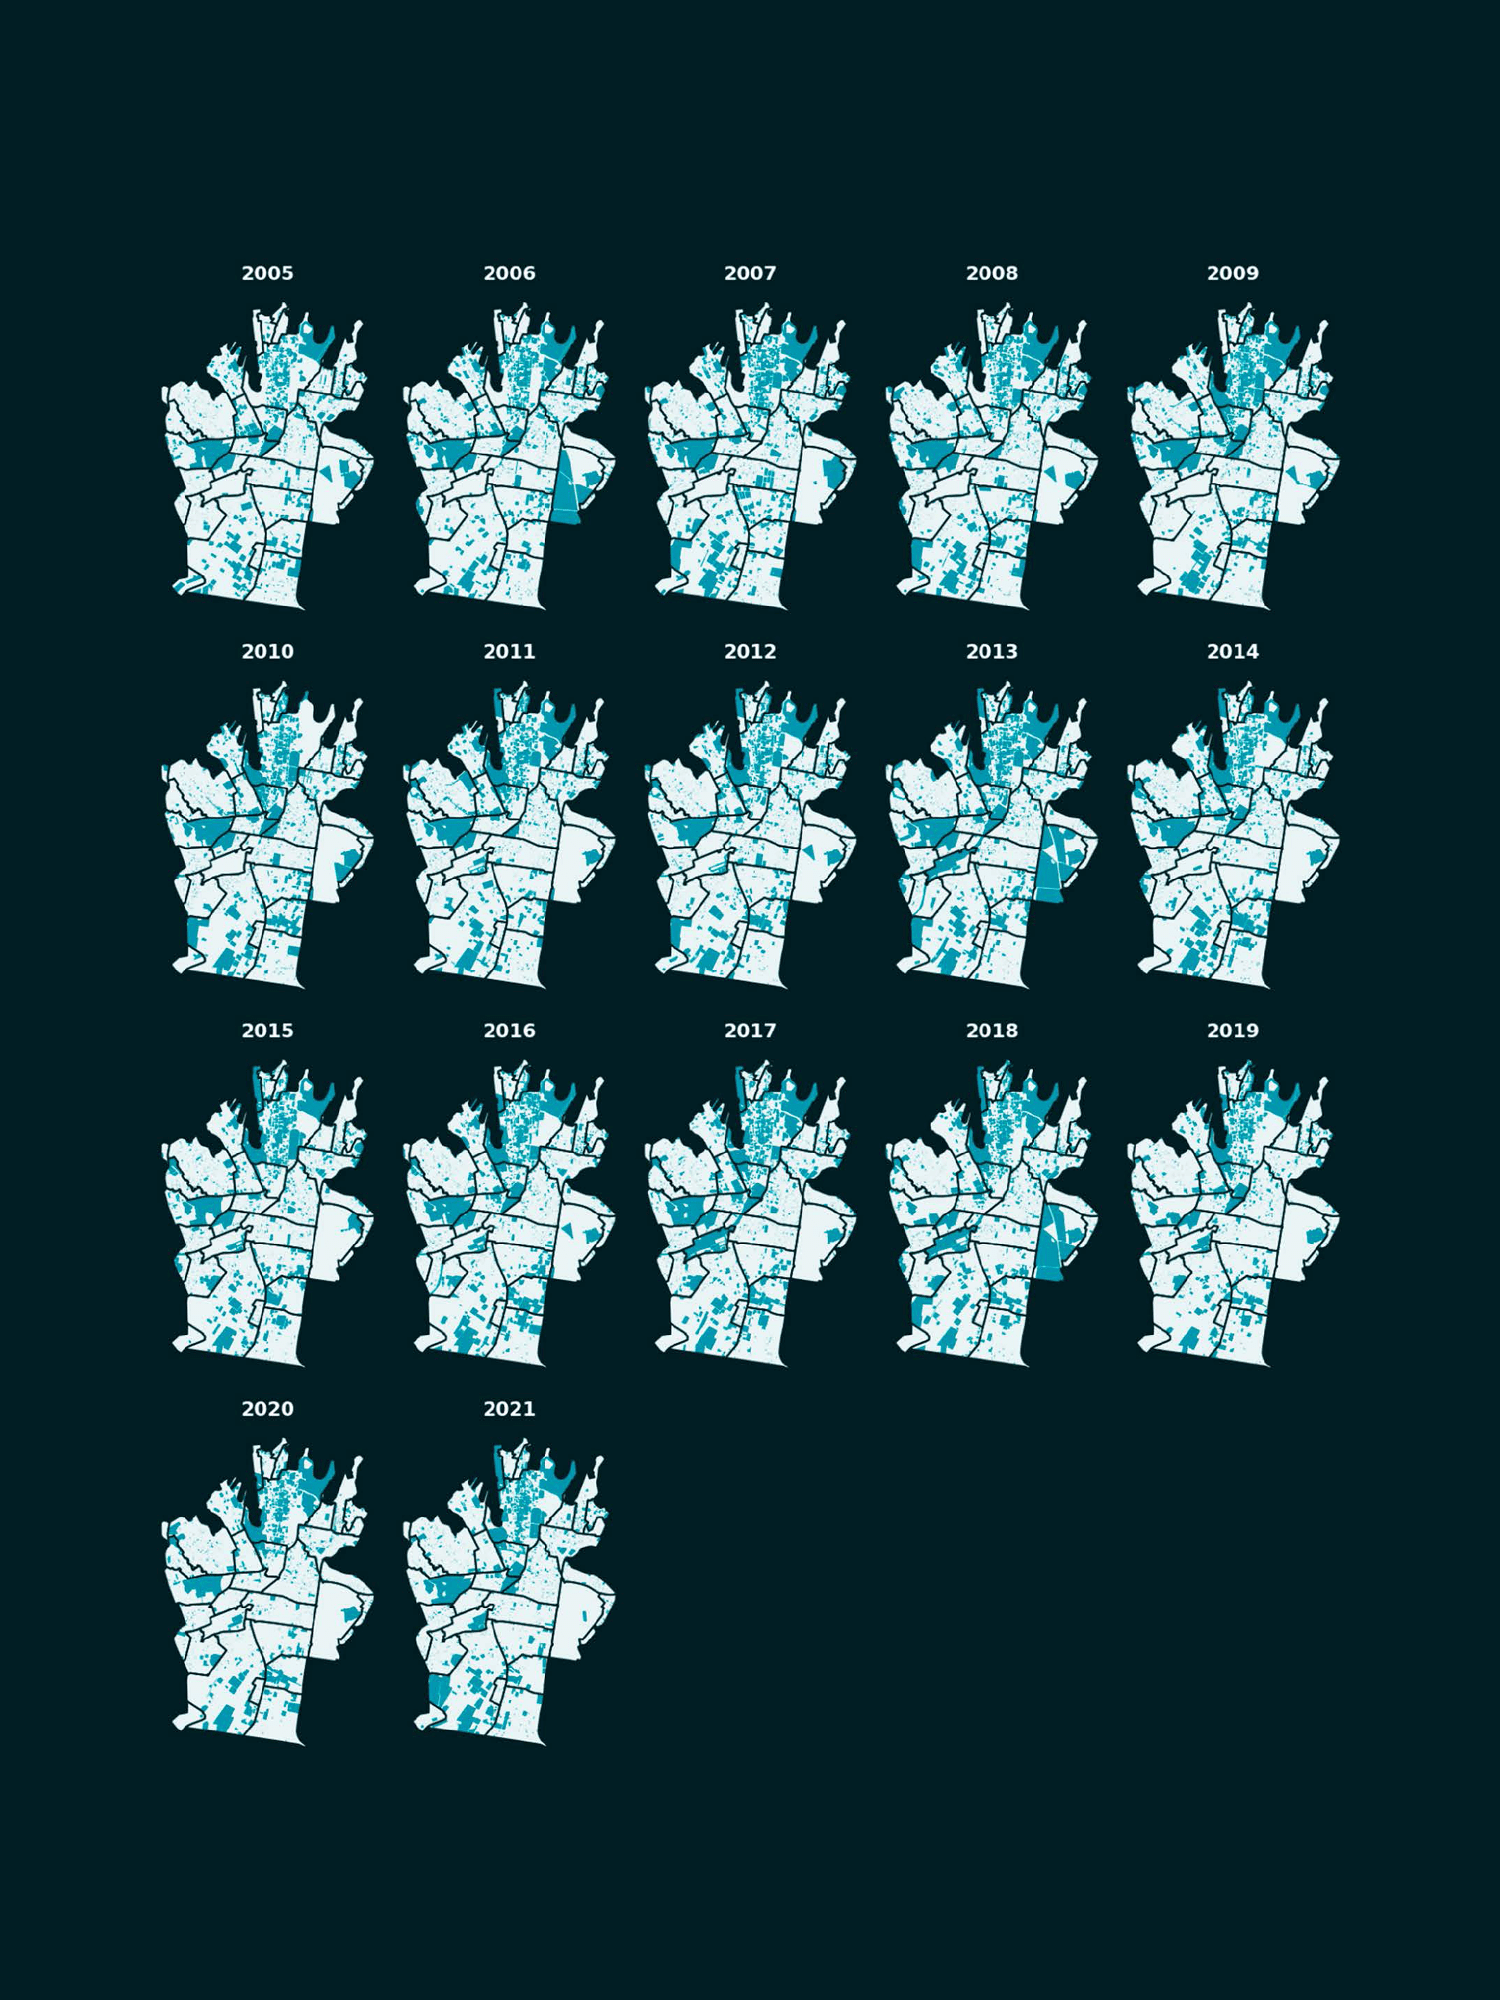
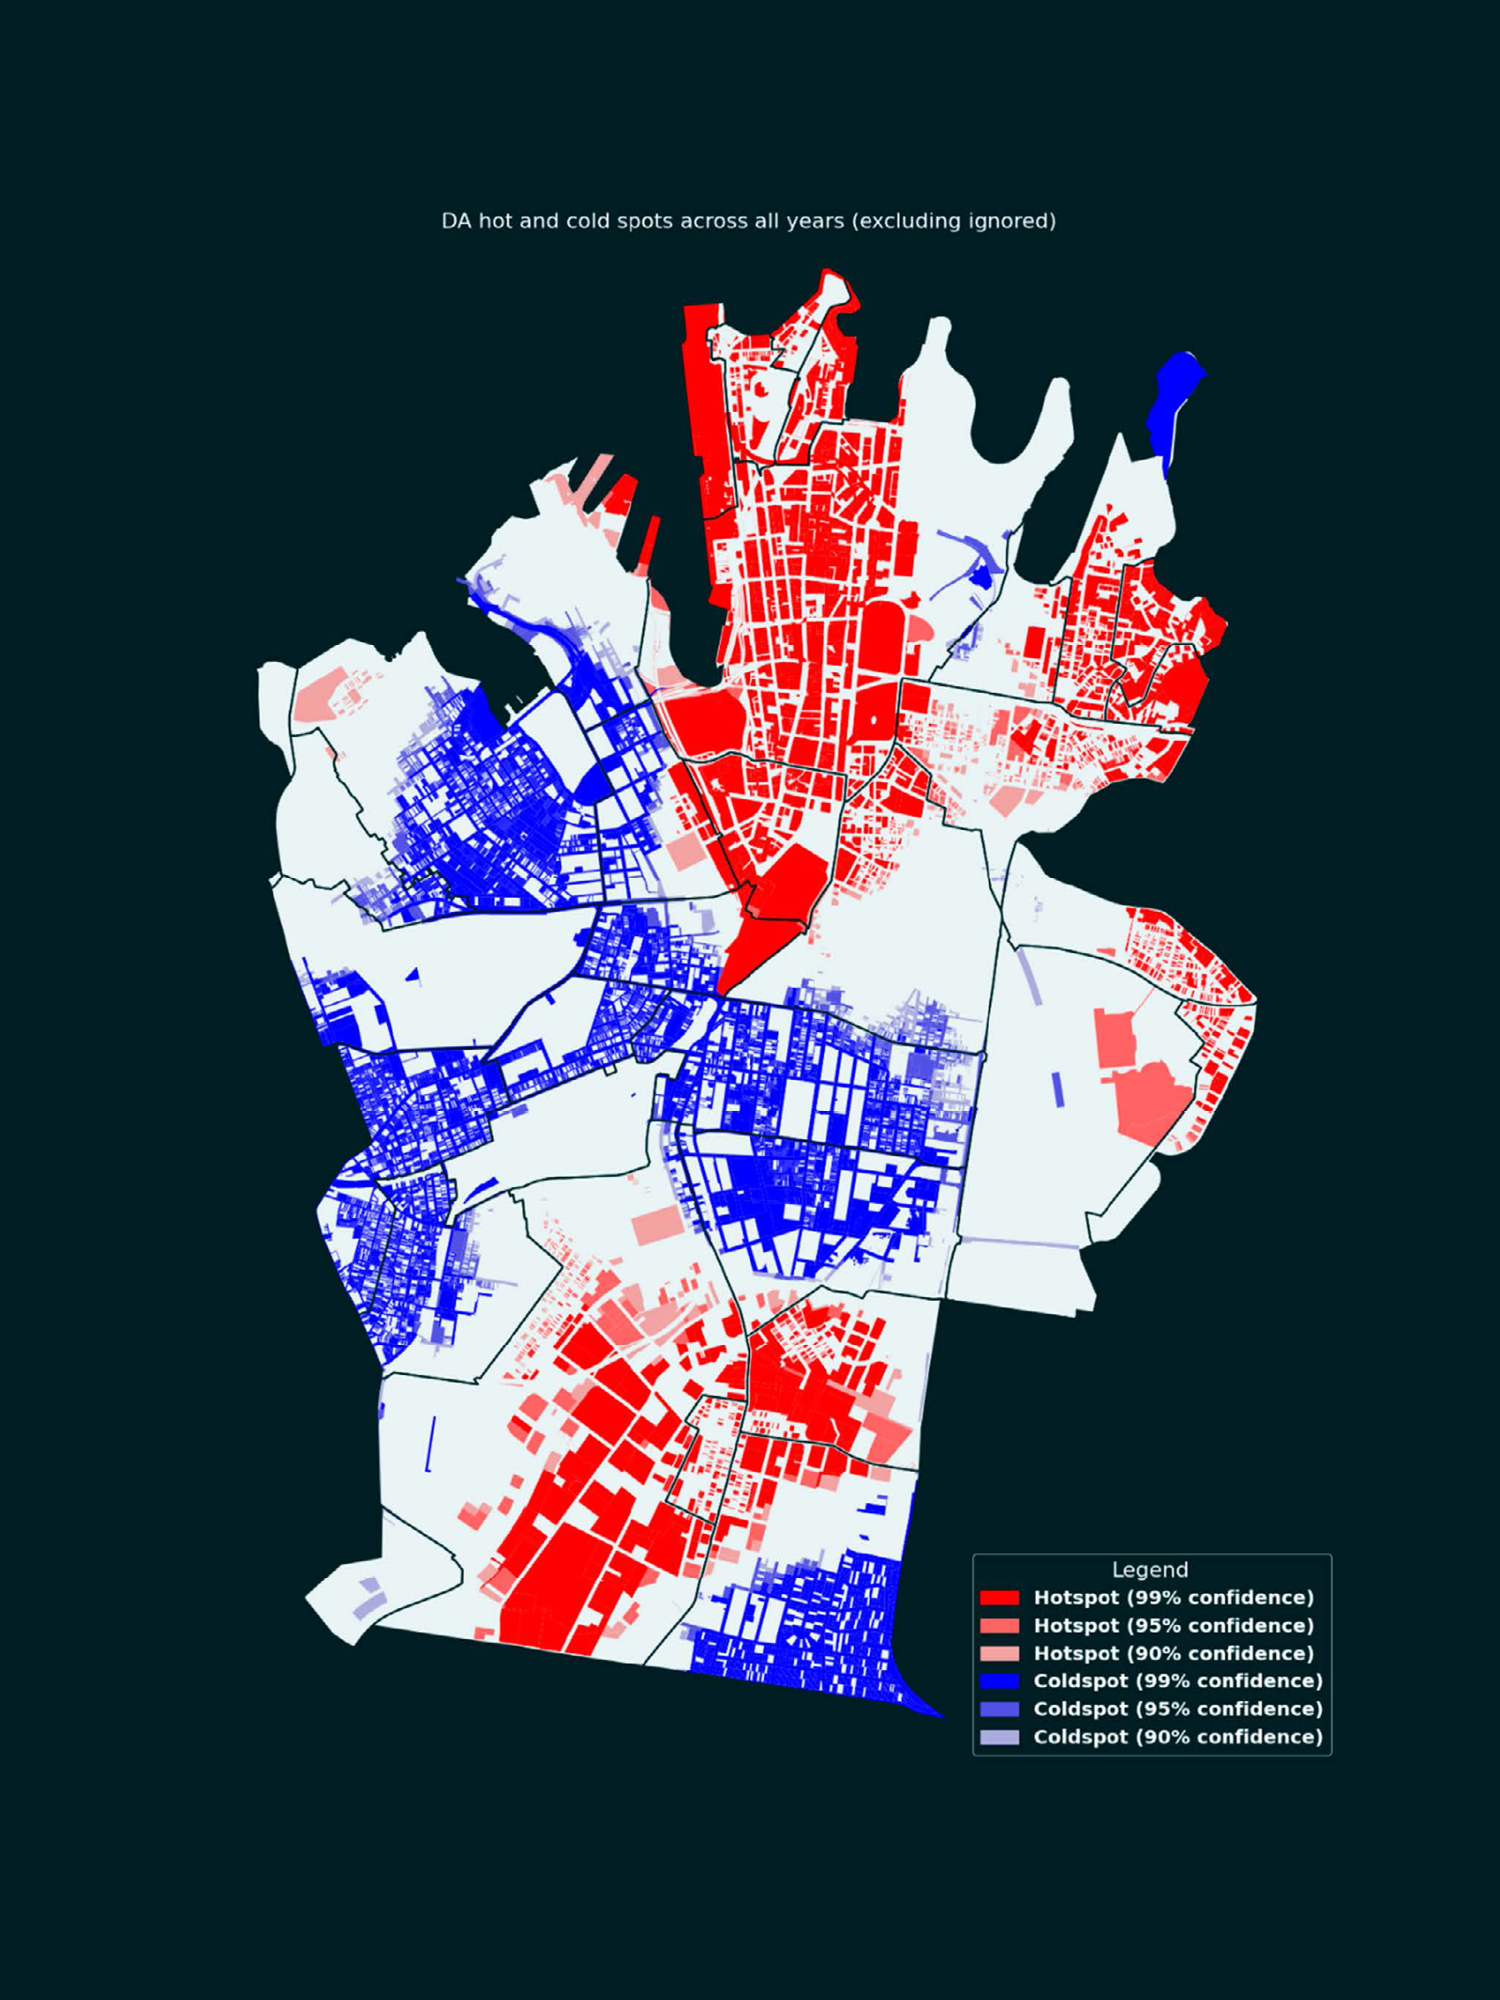
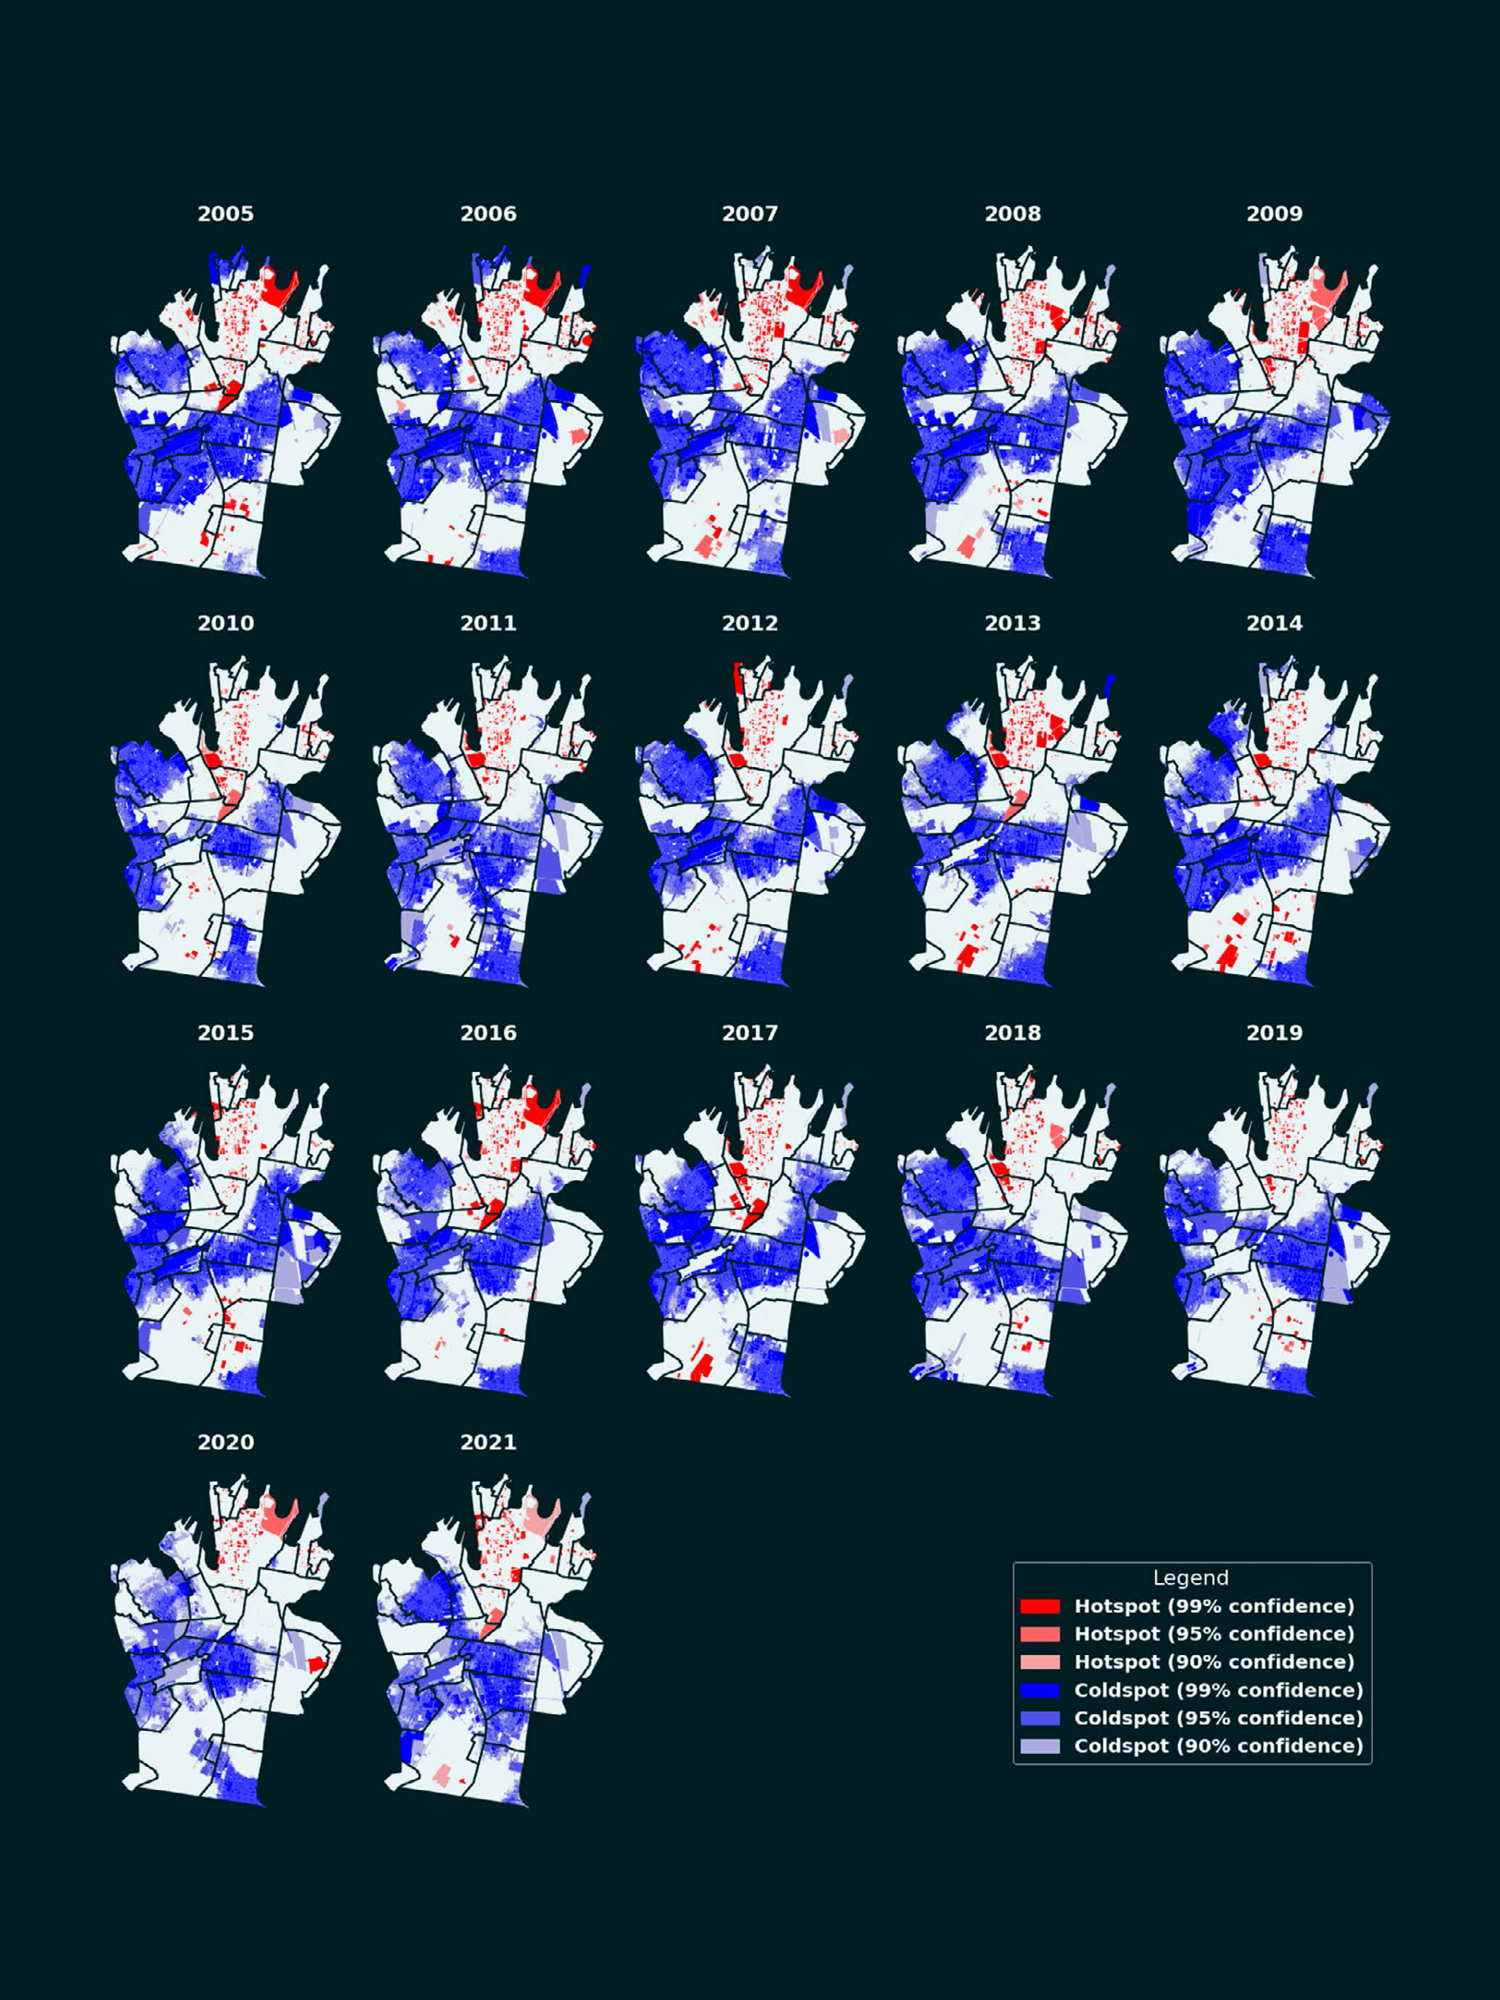
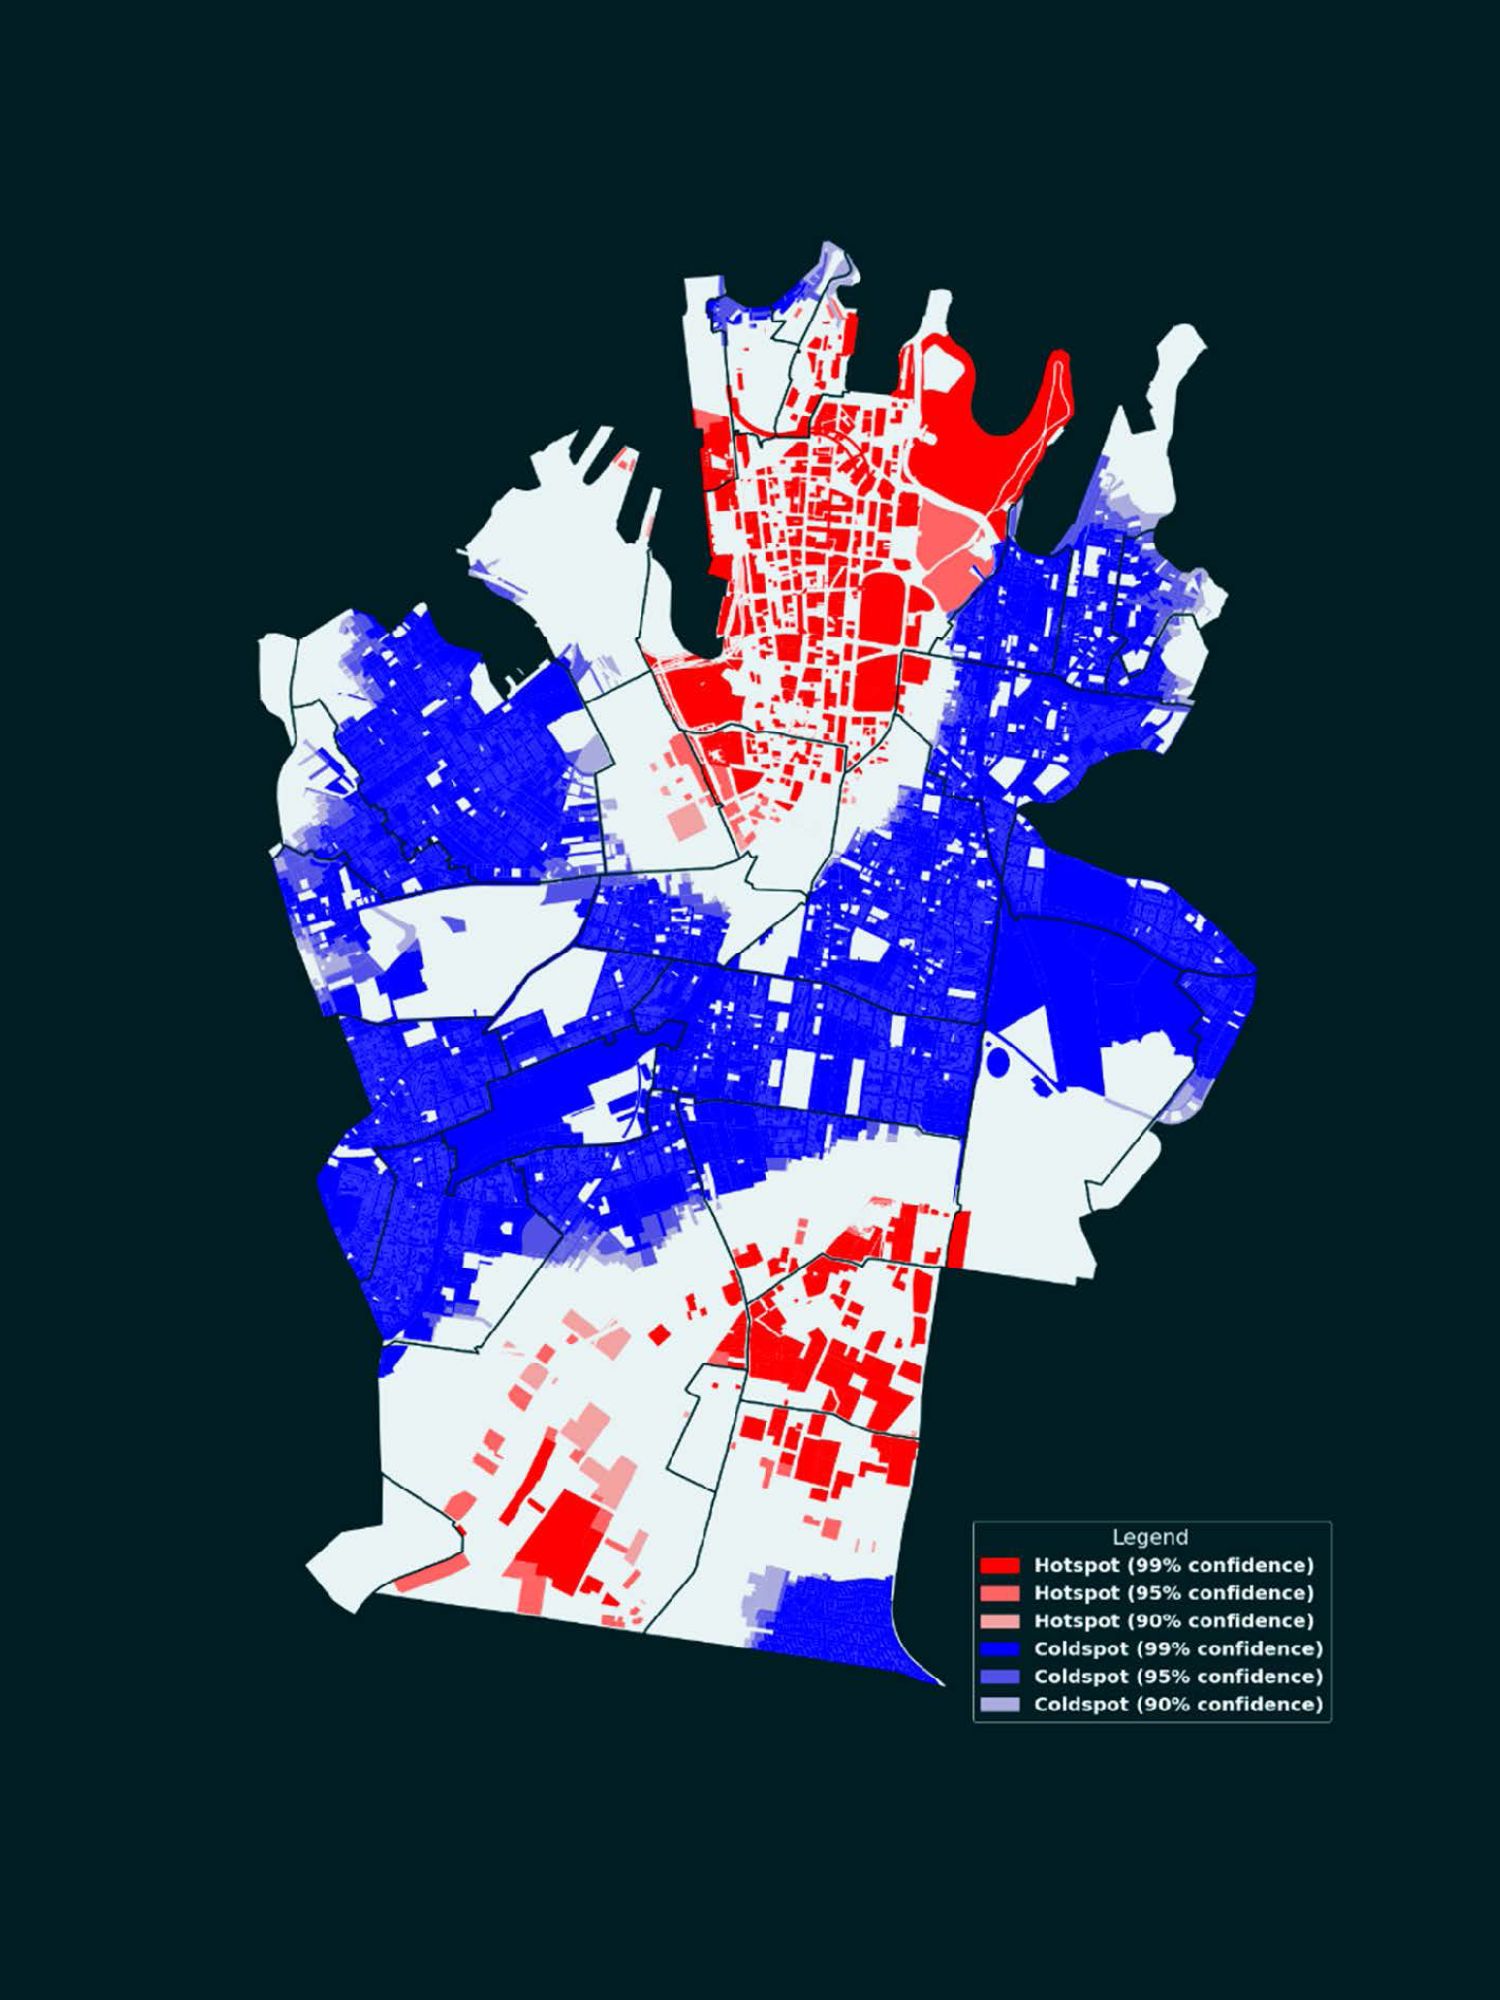
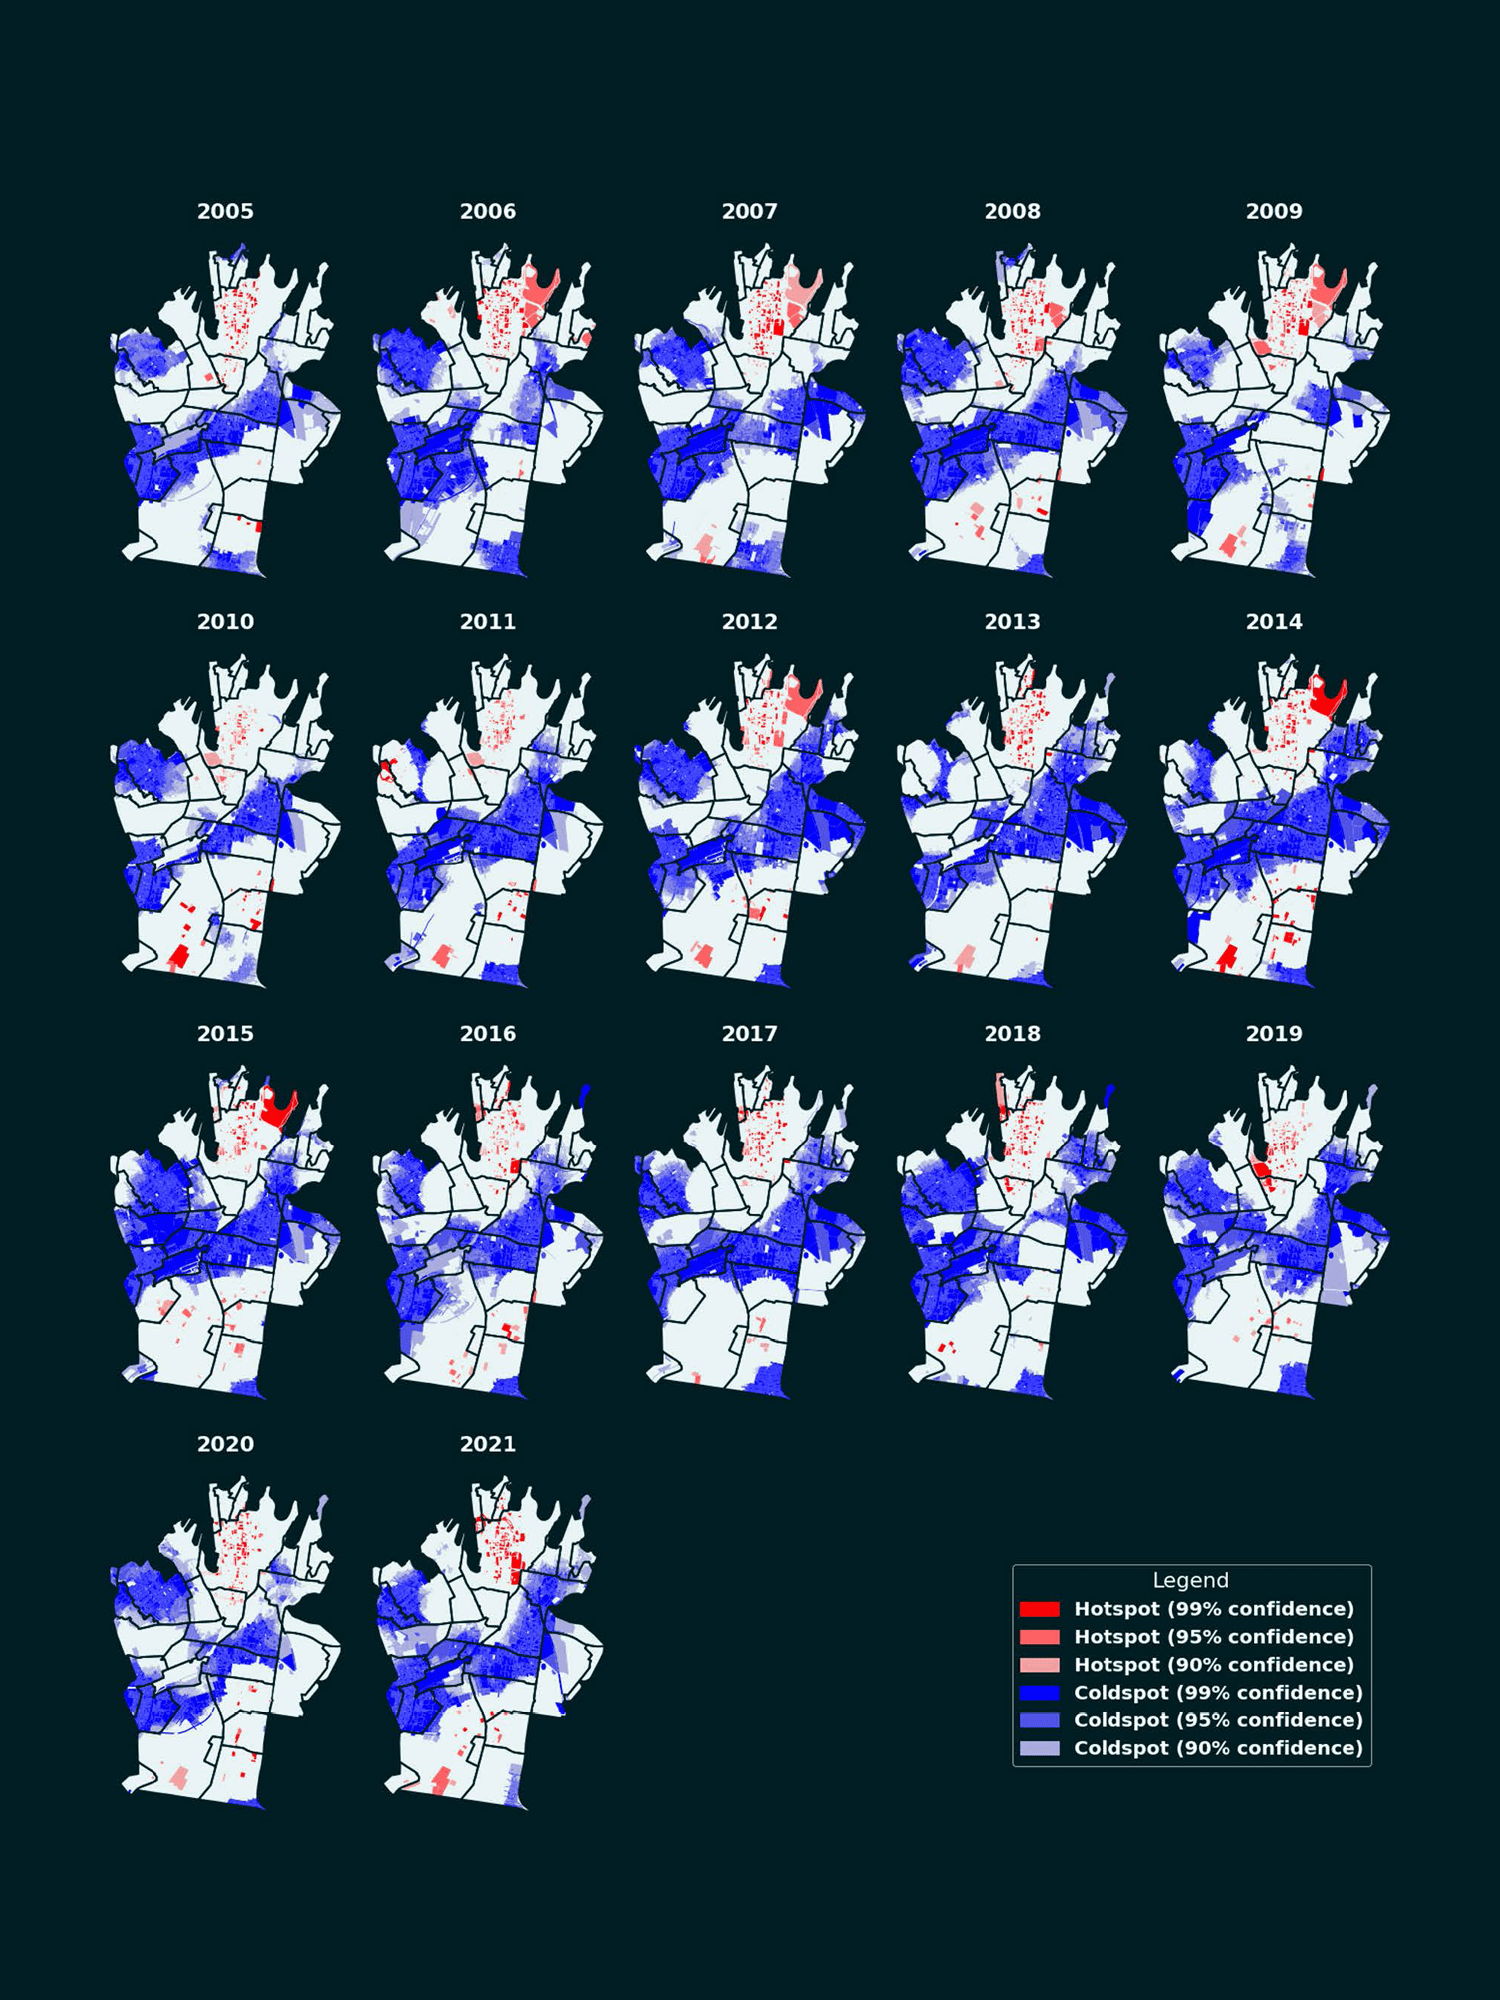
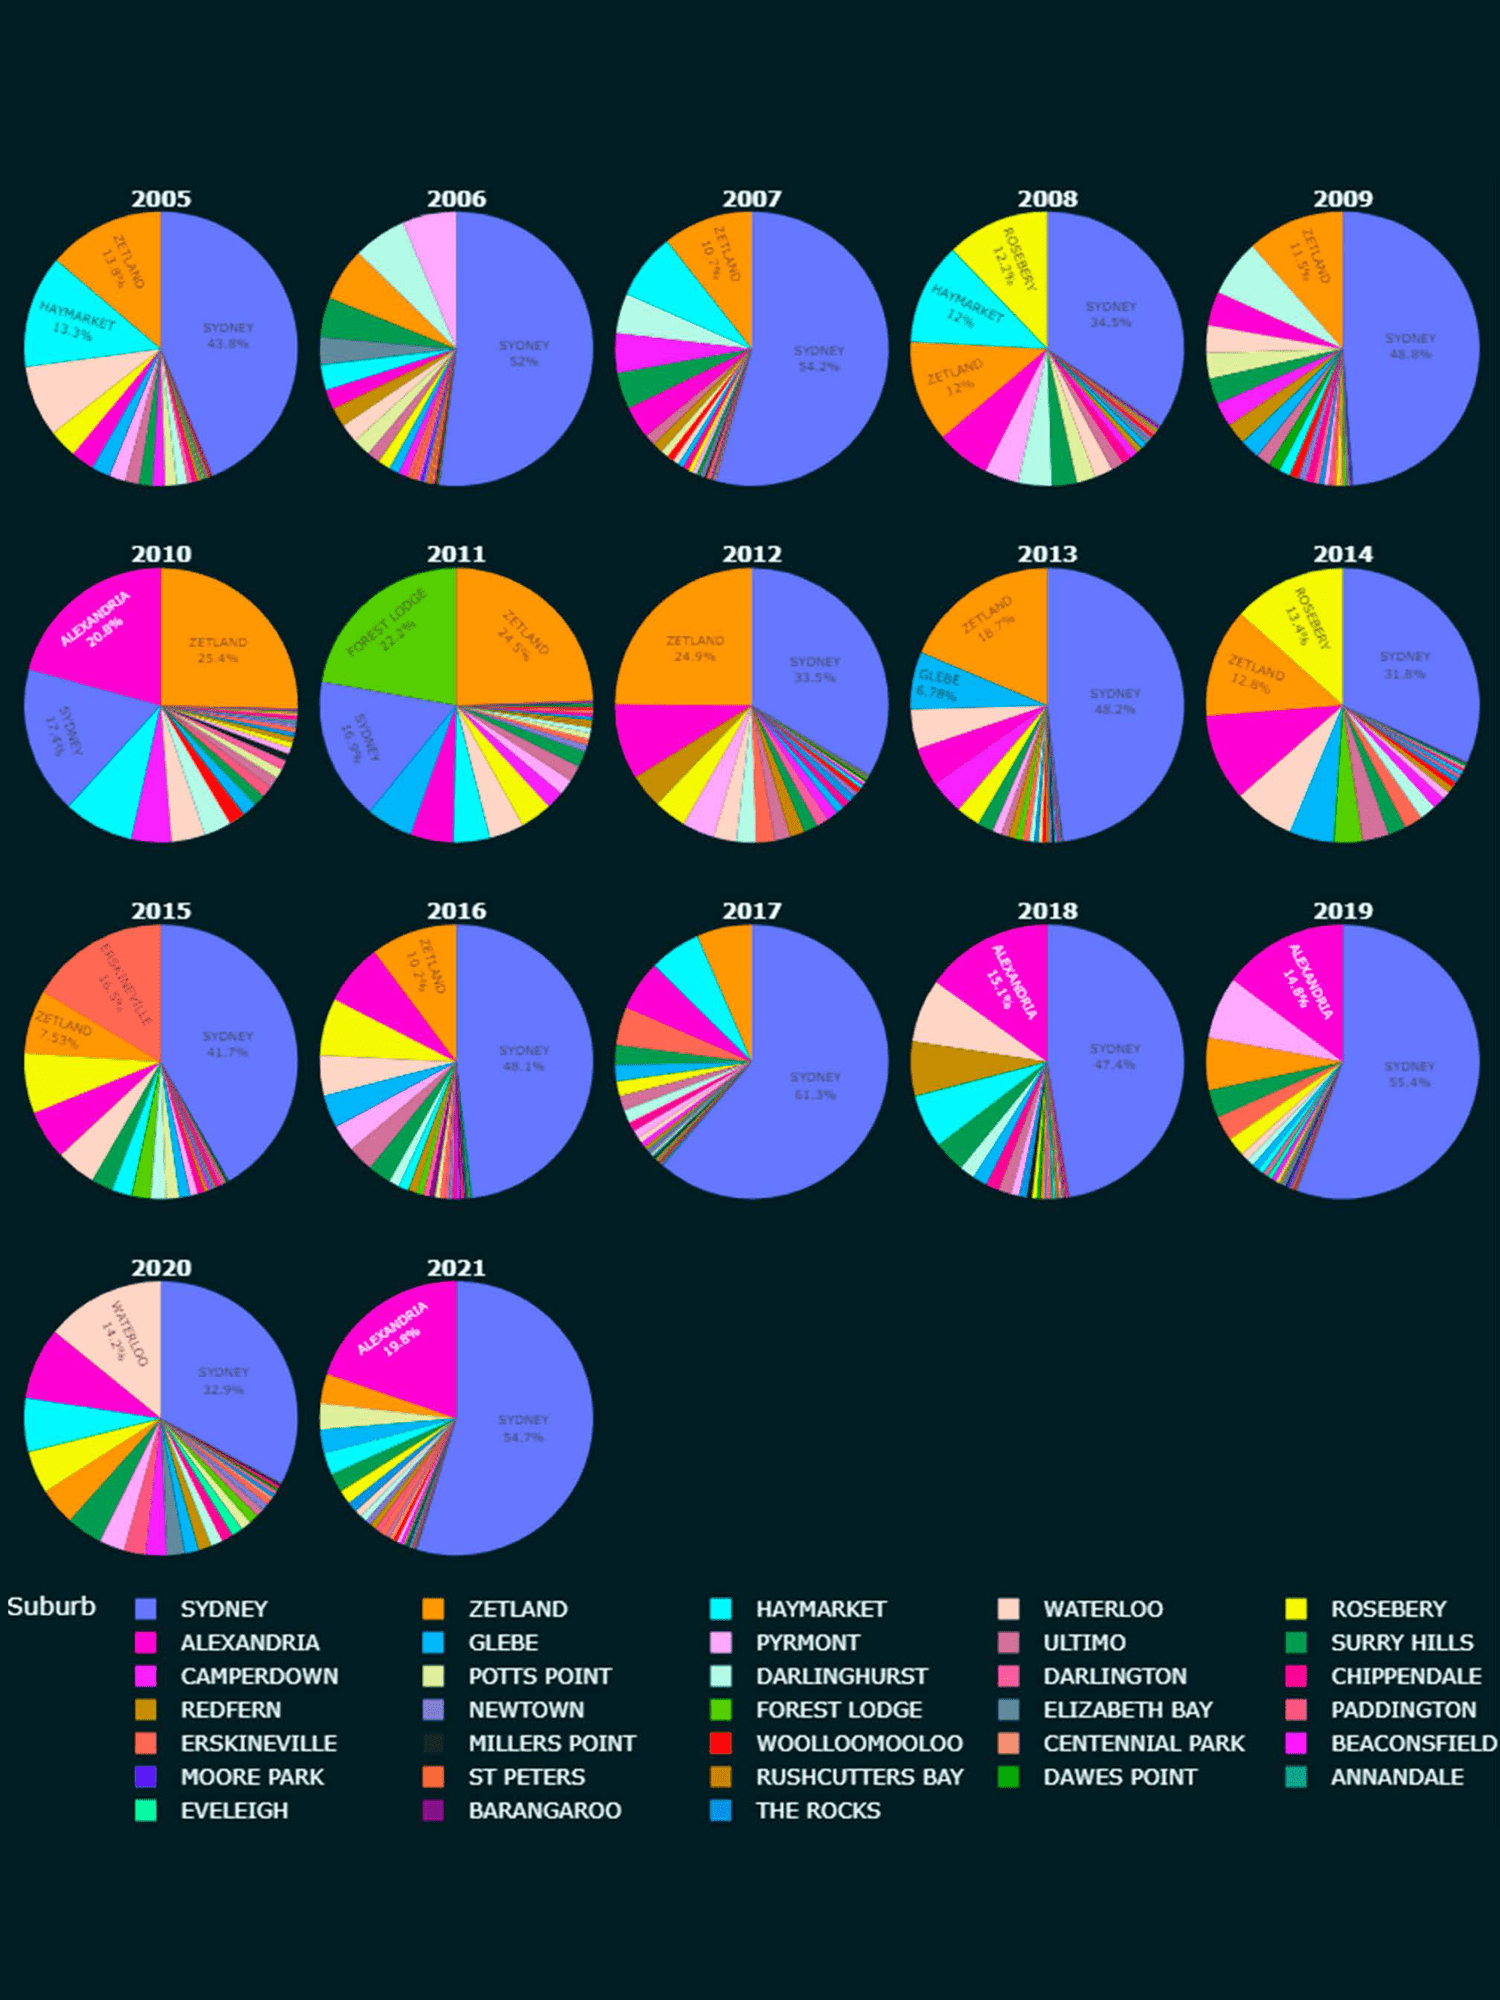
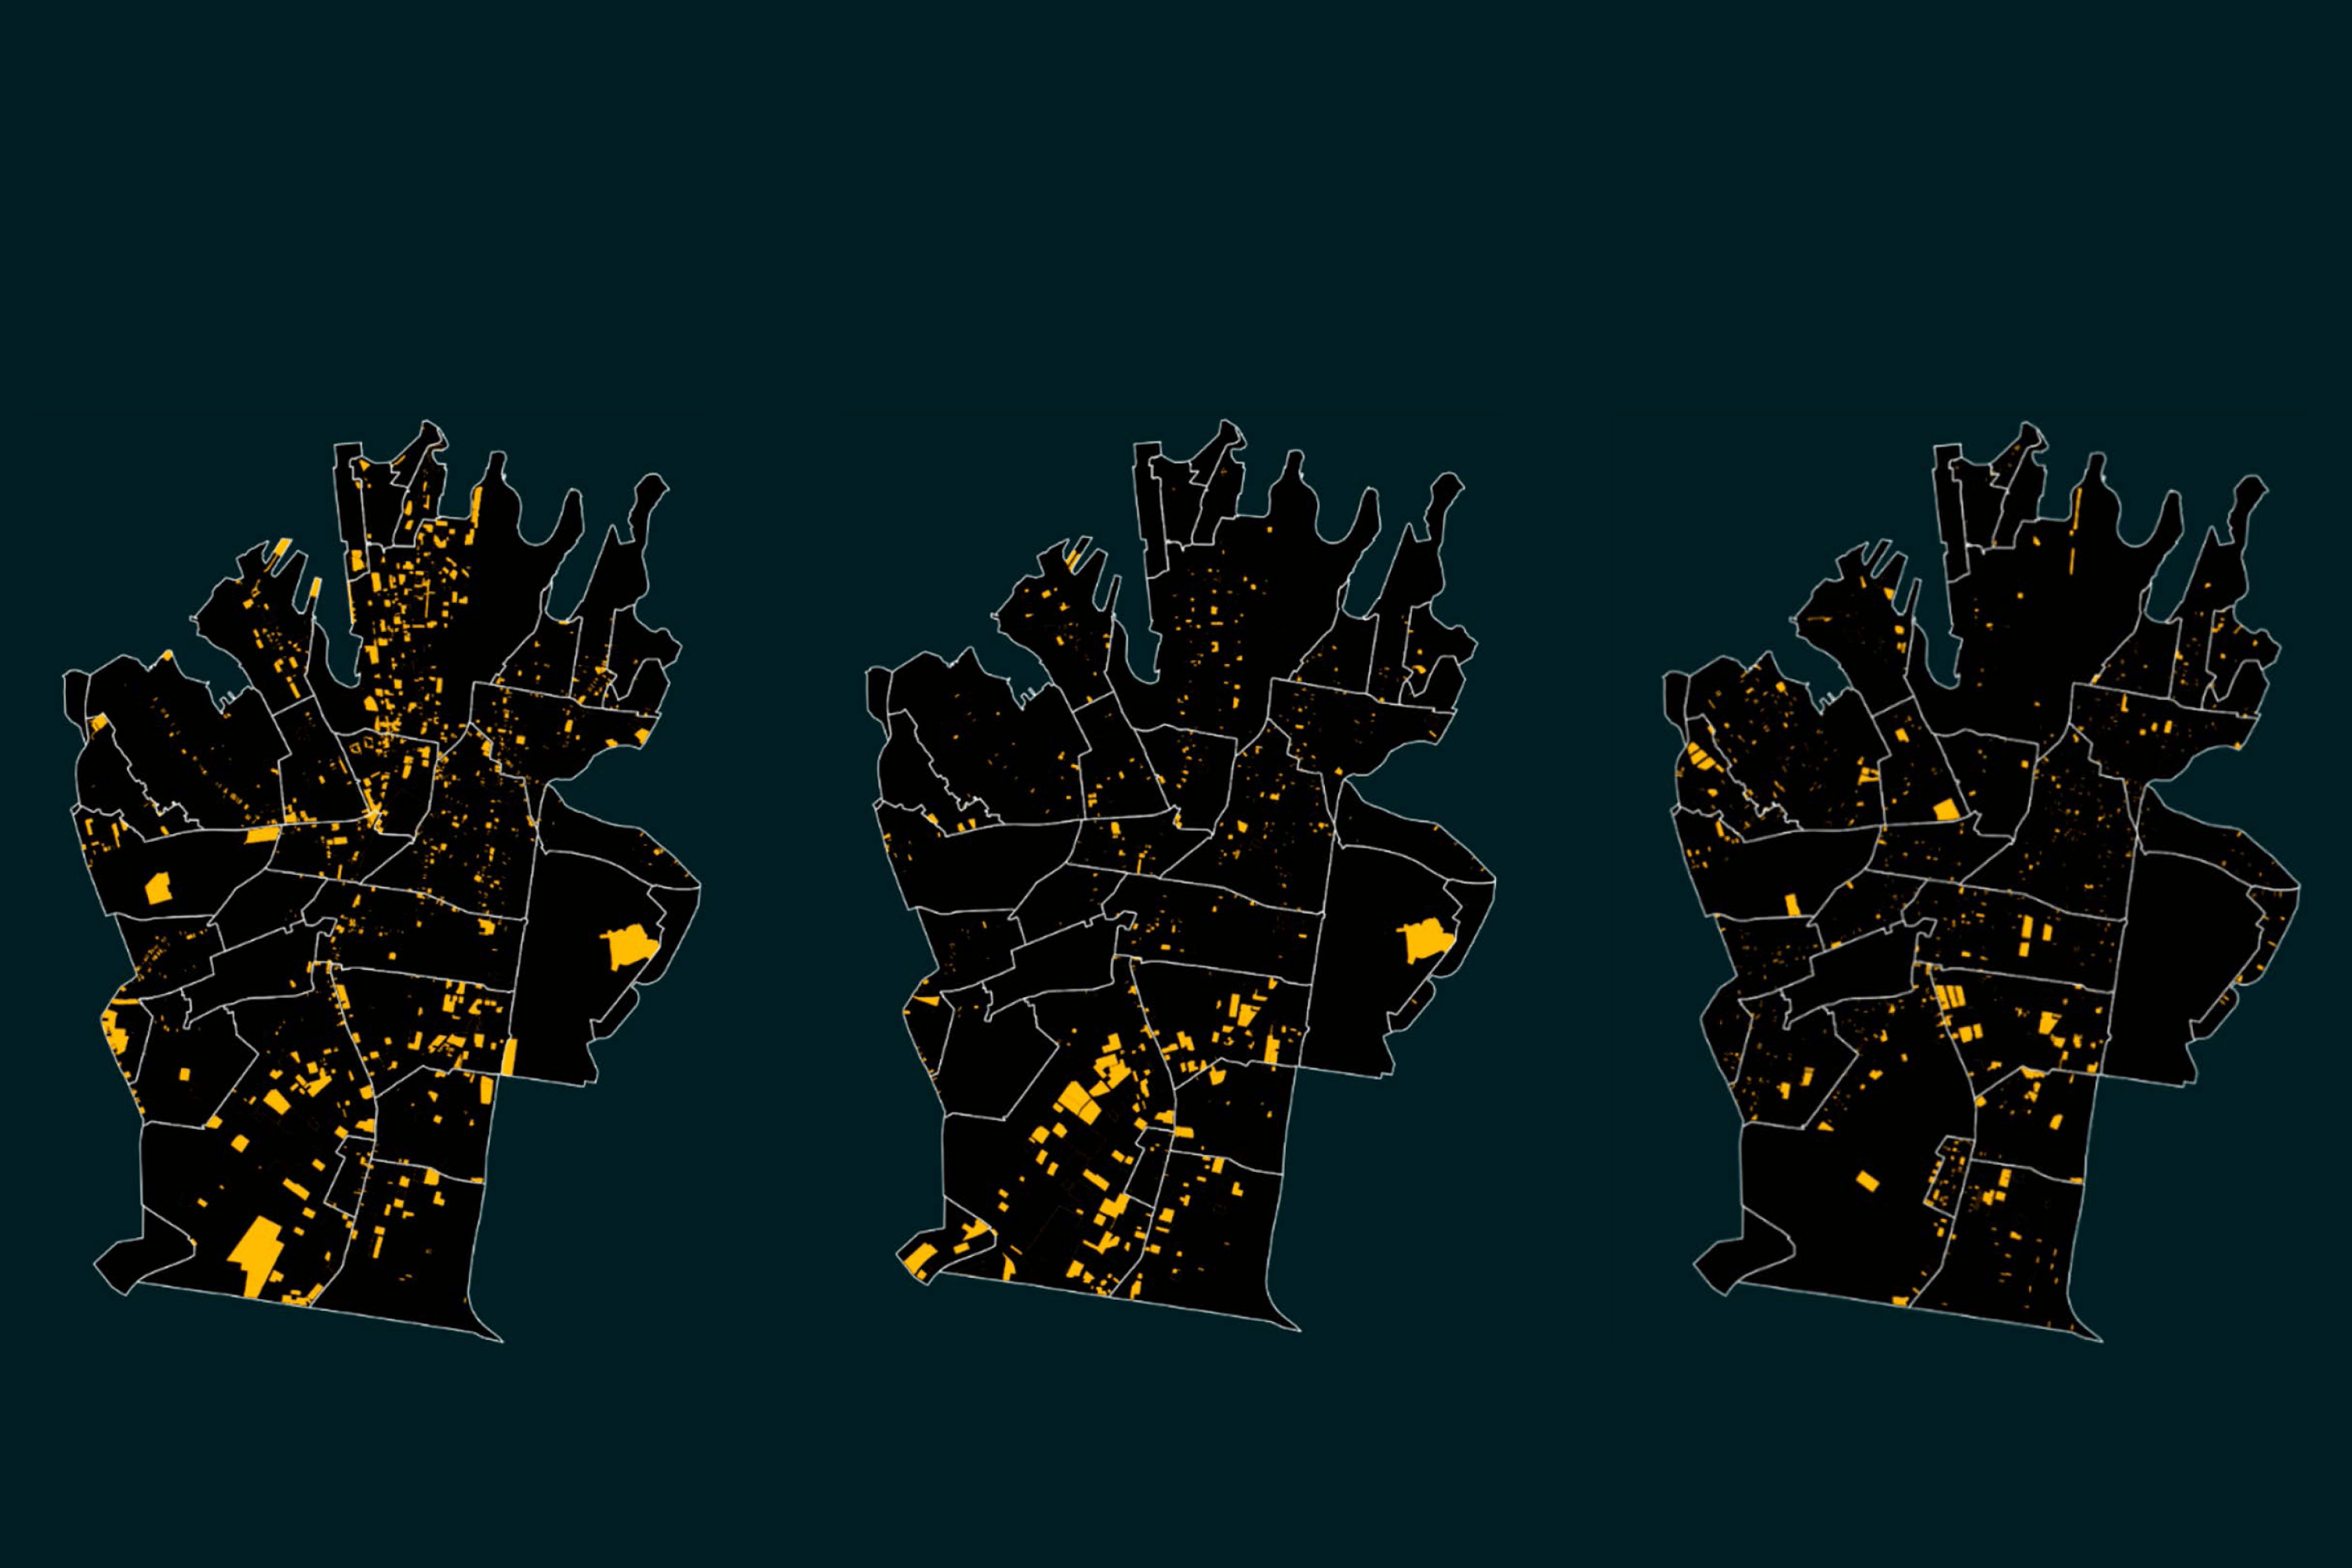
The spatiotemporal analysis of development hotspots highlights a strong development push in specific suburbs (the Sydney CBD and Zetland), whereas other areas such as Glebe, Redfern or the northern part of Waterloo are cold spots of development. This result was consistent with a development intensity or DA count, as well as with a development value (estimated cost) analysis. Further investigation into the correlation between cold spots and social phenomena, in particular income levels and economic activity, could be a topic for future research.

DA Processing as a Constraint on Socioeconomic Progress

Approval time was argued by many as a key factor affecting housing affordability, as it reduces the potential pace of housing supply and therefore drives prices up 21. The NSW planning and development assessment system has seen major reform since 2005 21. A key part of this transformation was to decrease development assessment times and costs 21. Measures taken to achieve this included transferring planning power from local government to independent parties or state government, to remove local politics from the procedure 21.

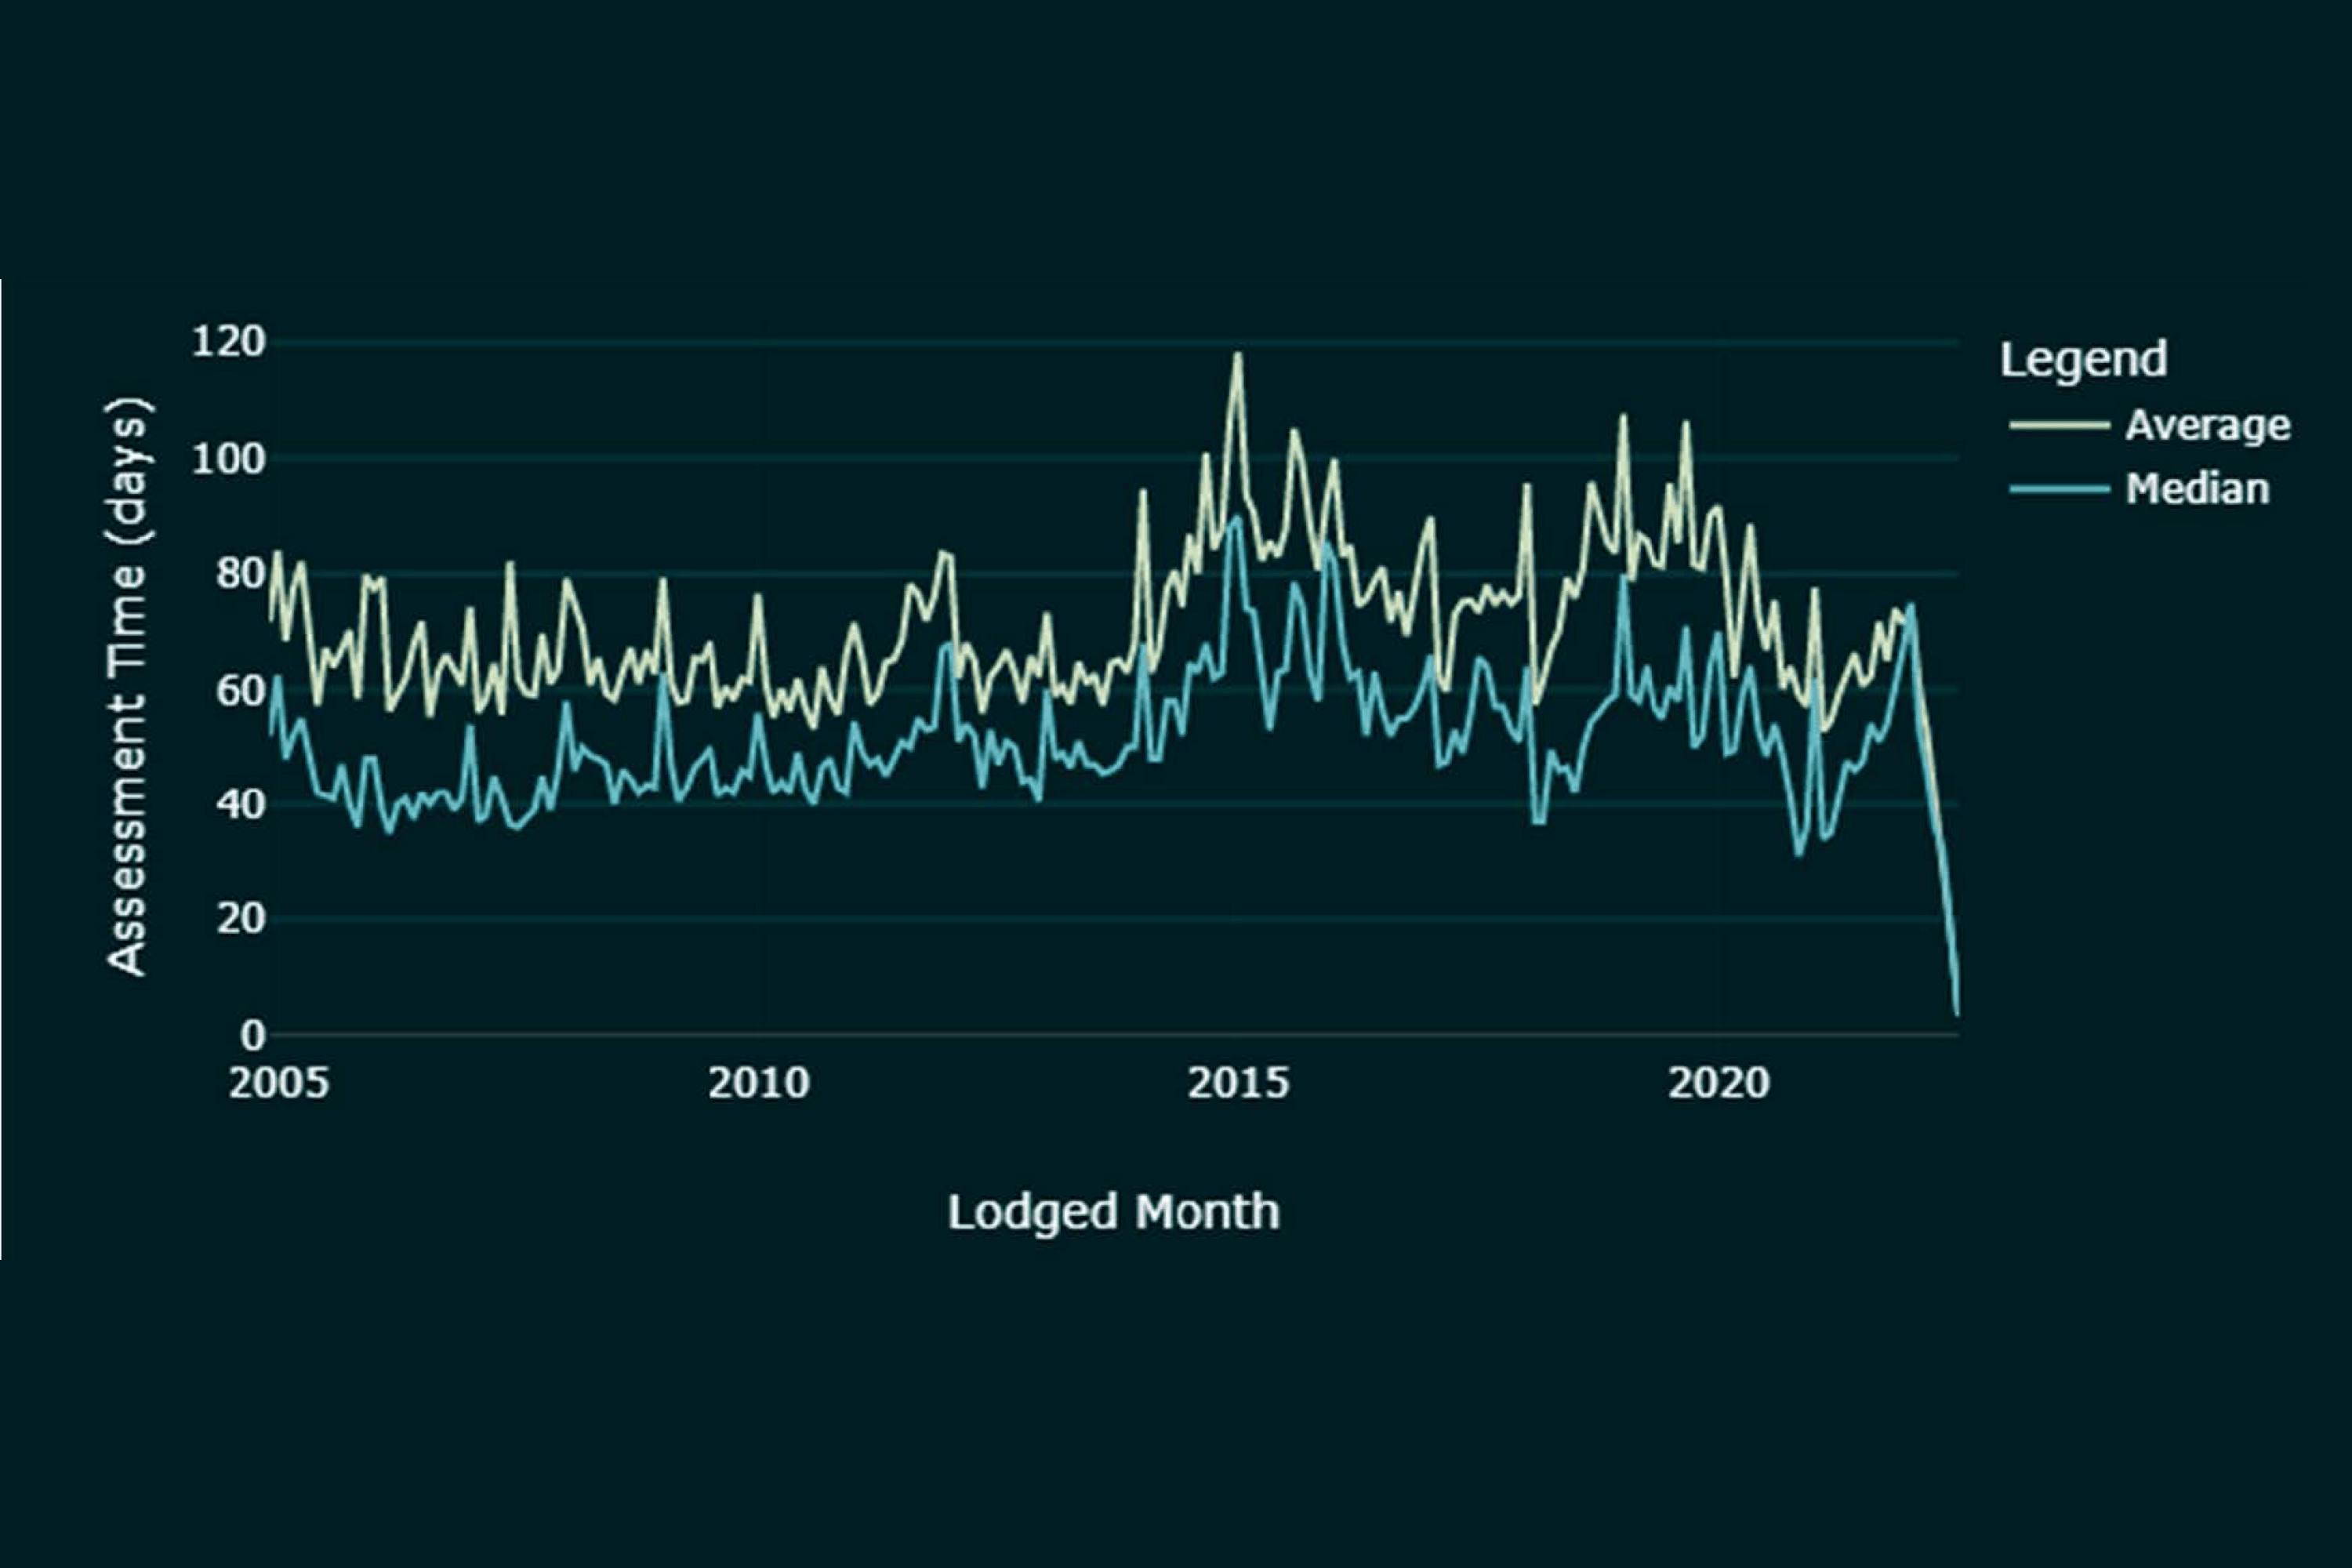
Ruming (2009) found that average assessment time in Inner- and Middle-ring NSW LGAs was about 63 days, acknowledging that is probably due to the more complex investigation required on larger projects, rather than the result of intentional delay by government to hinder development activities 21.

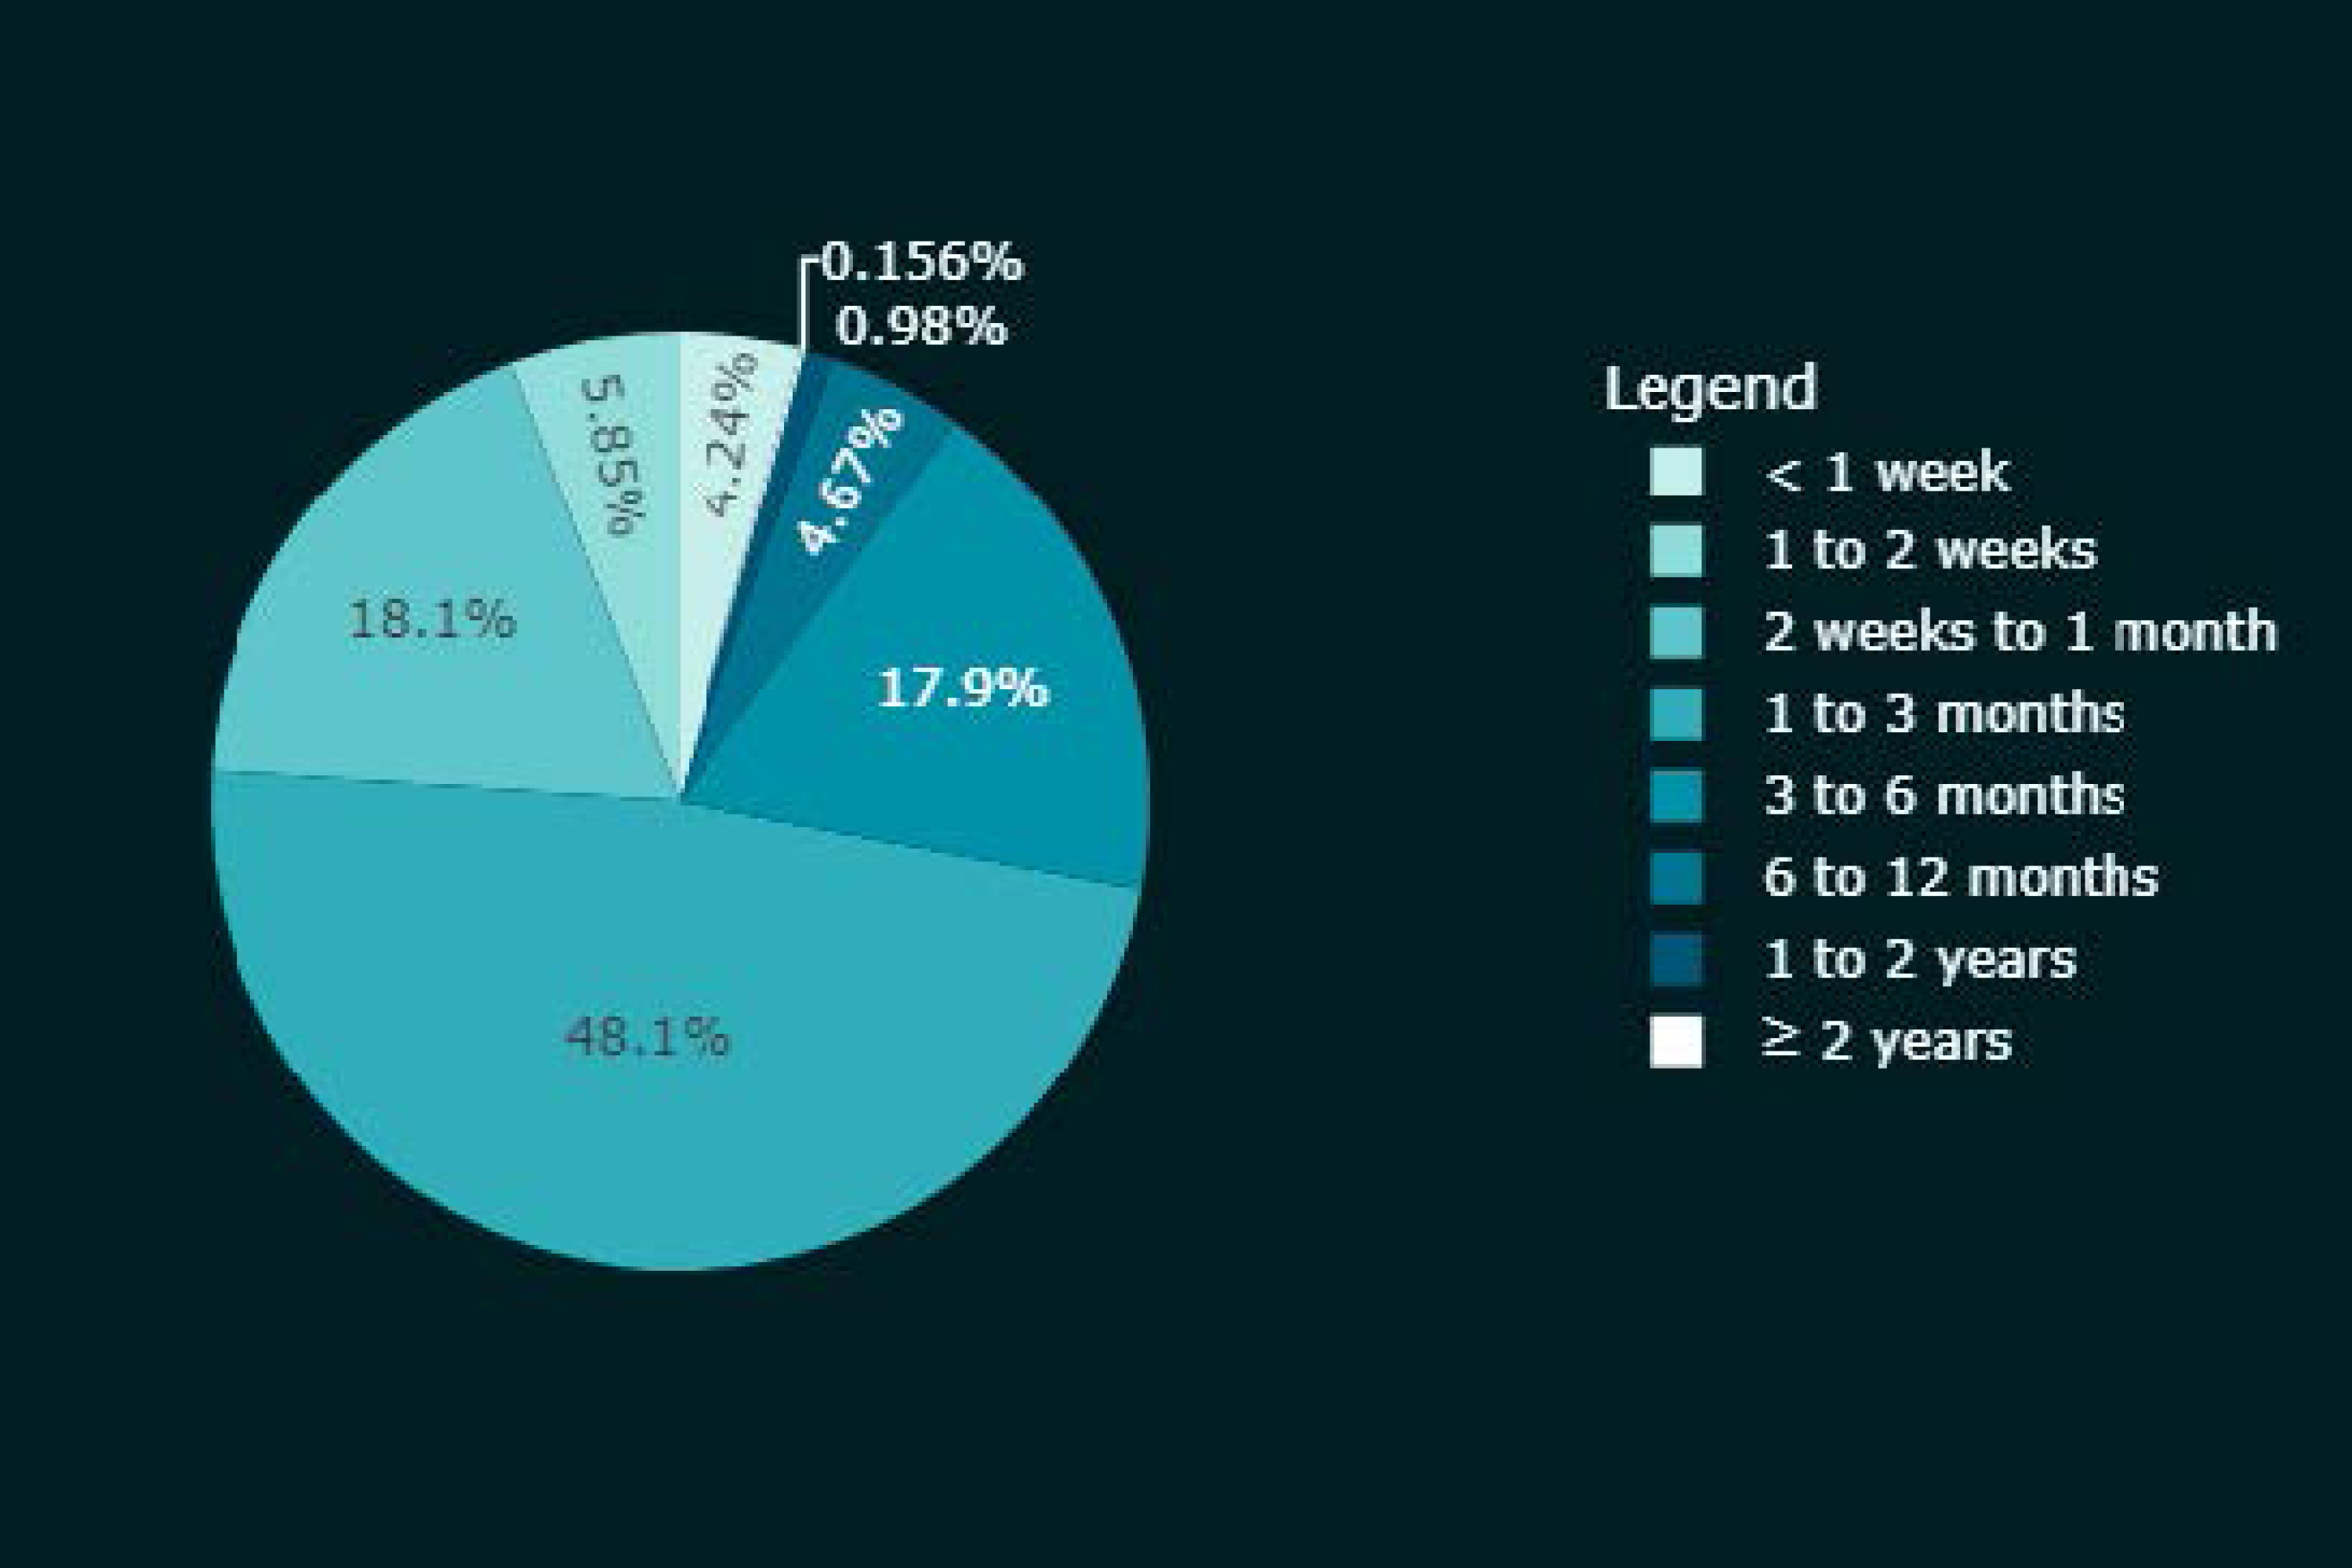
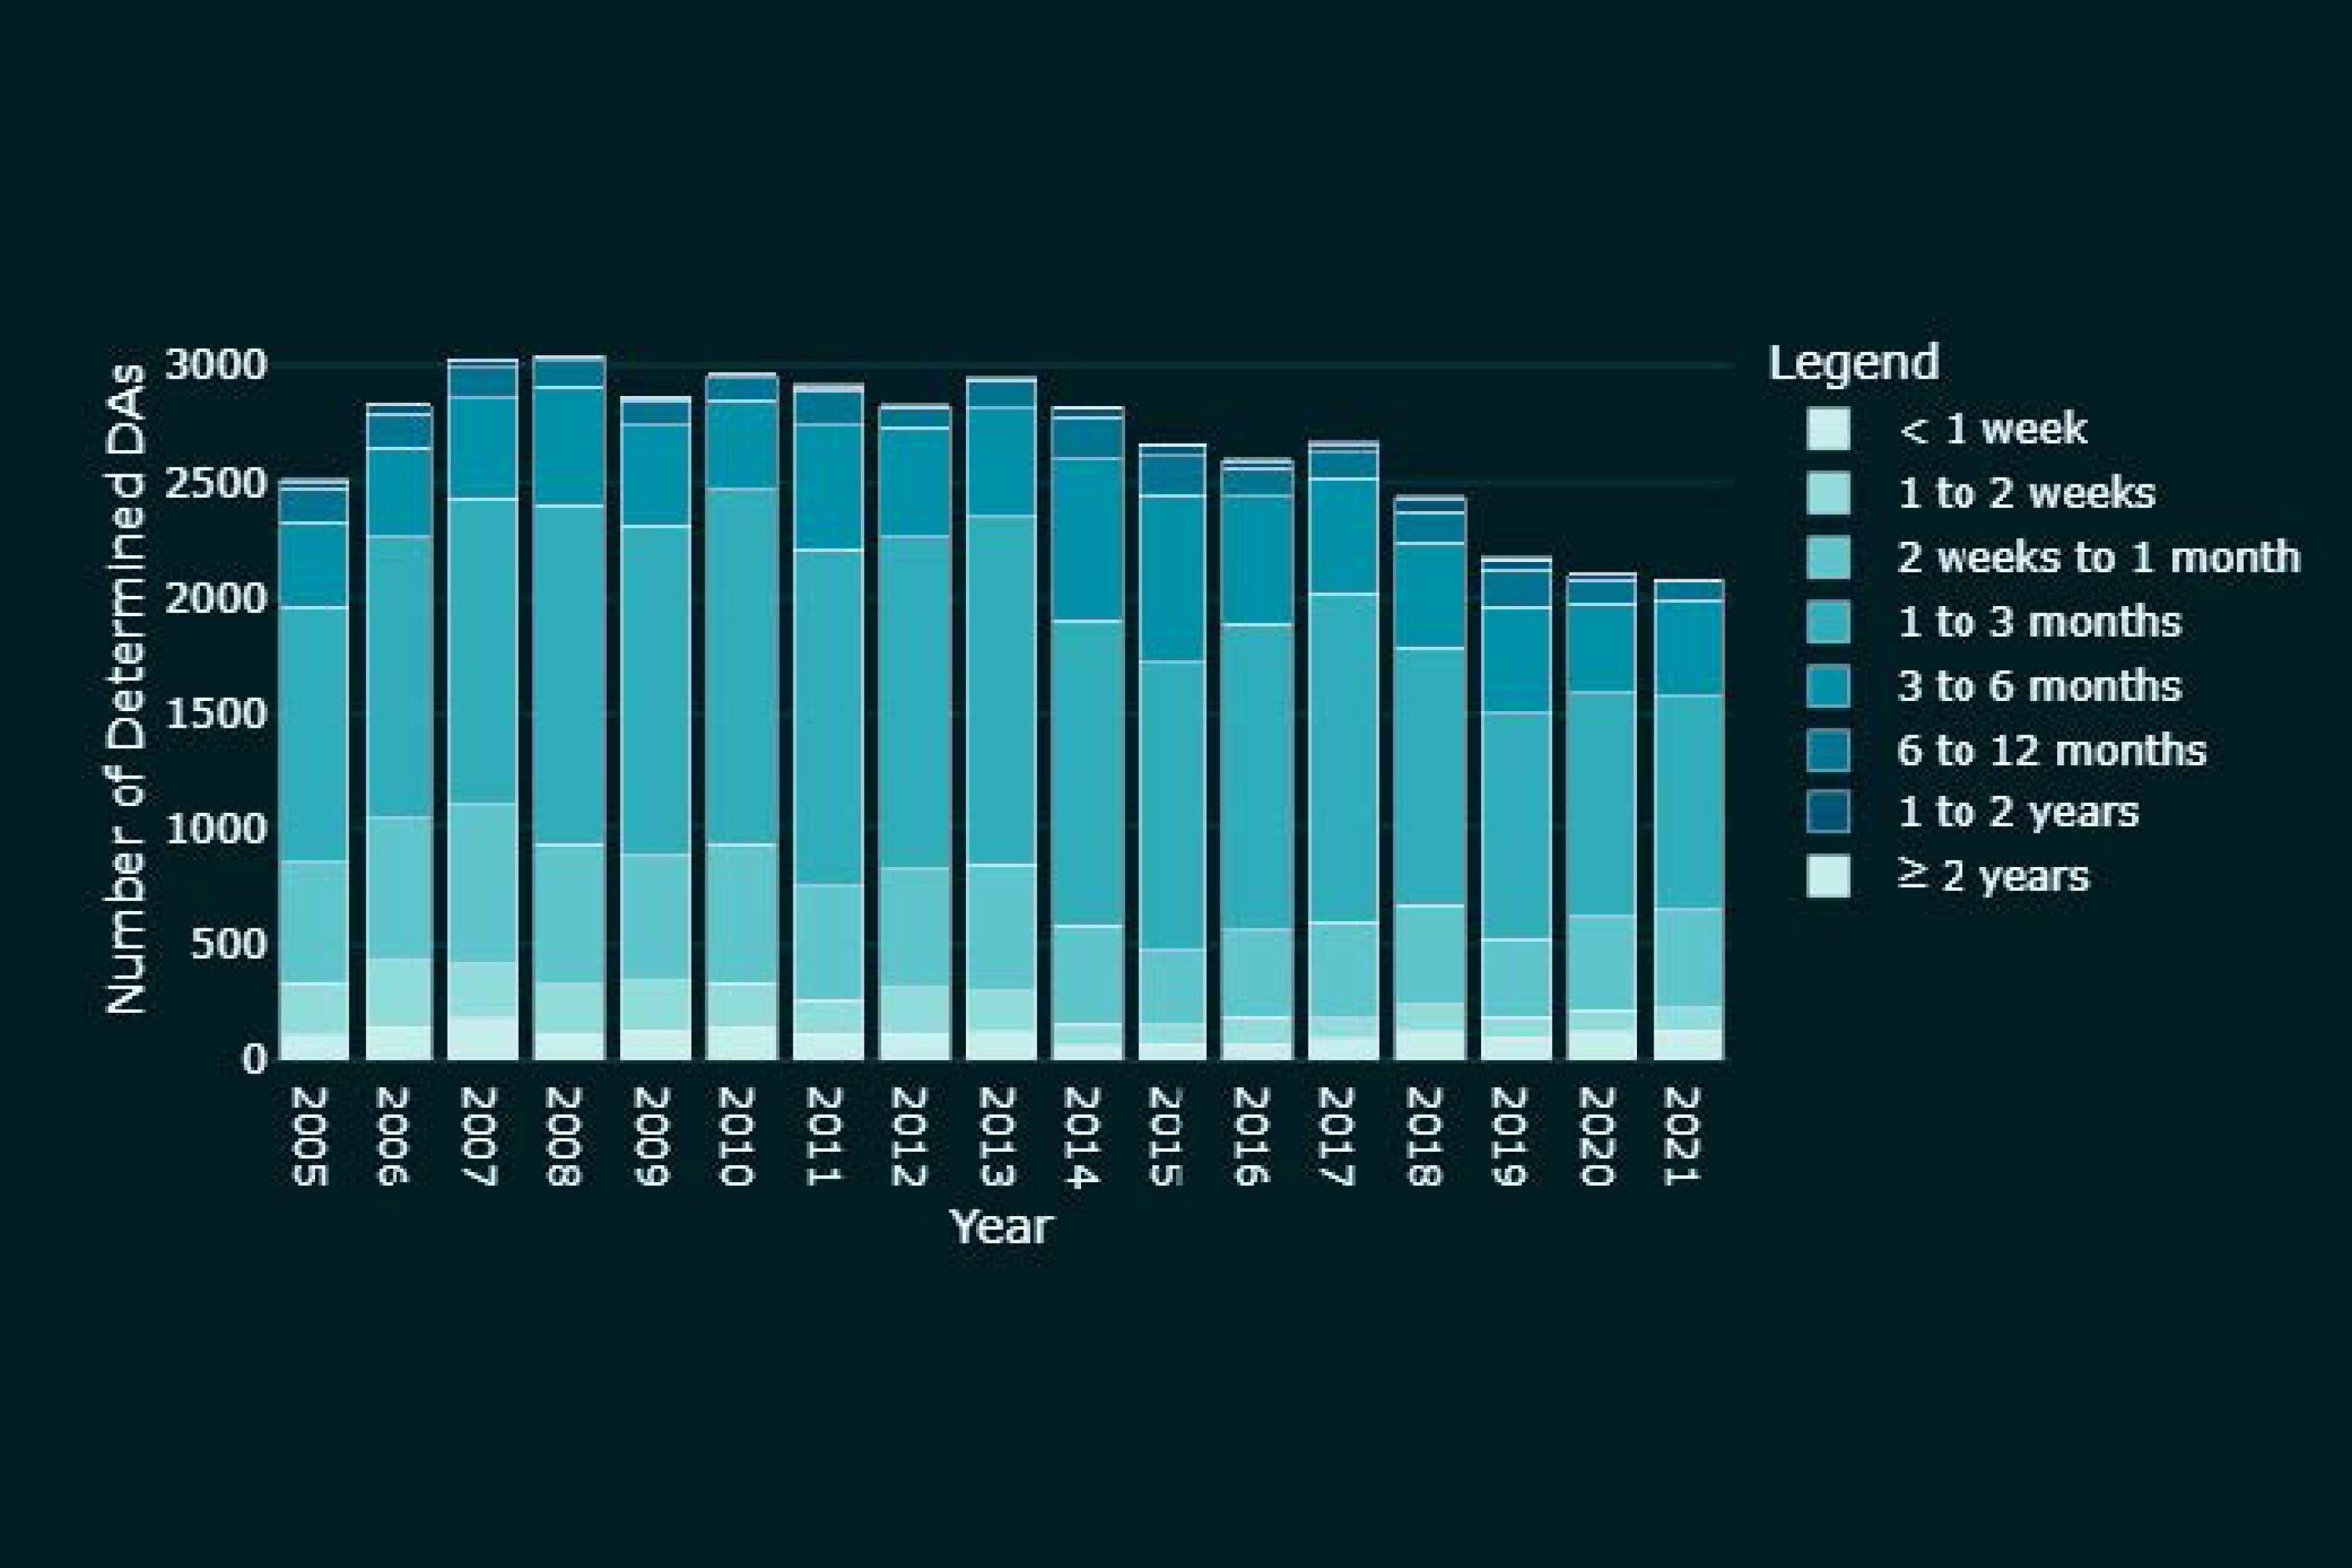
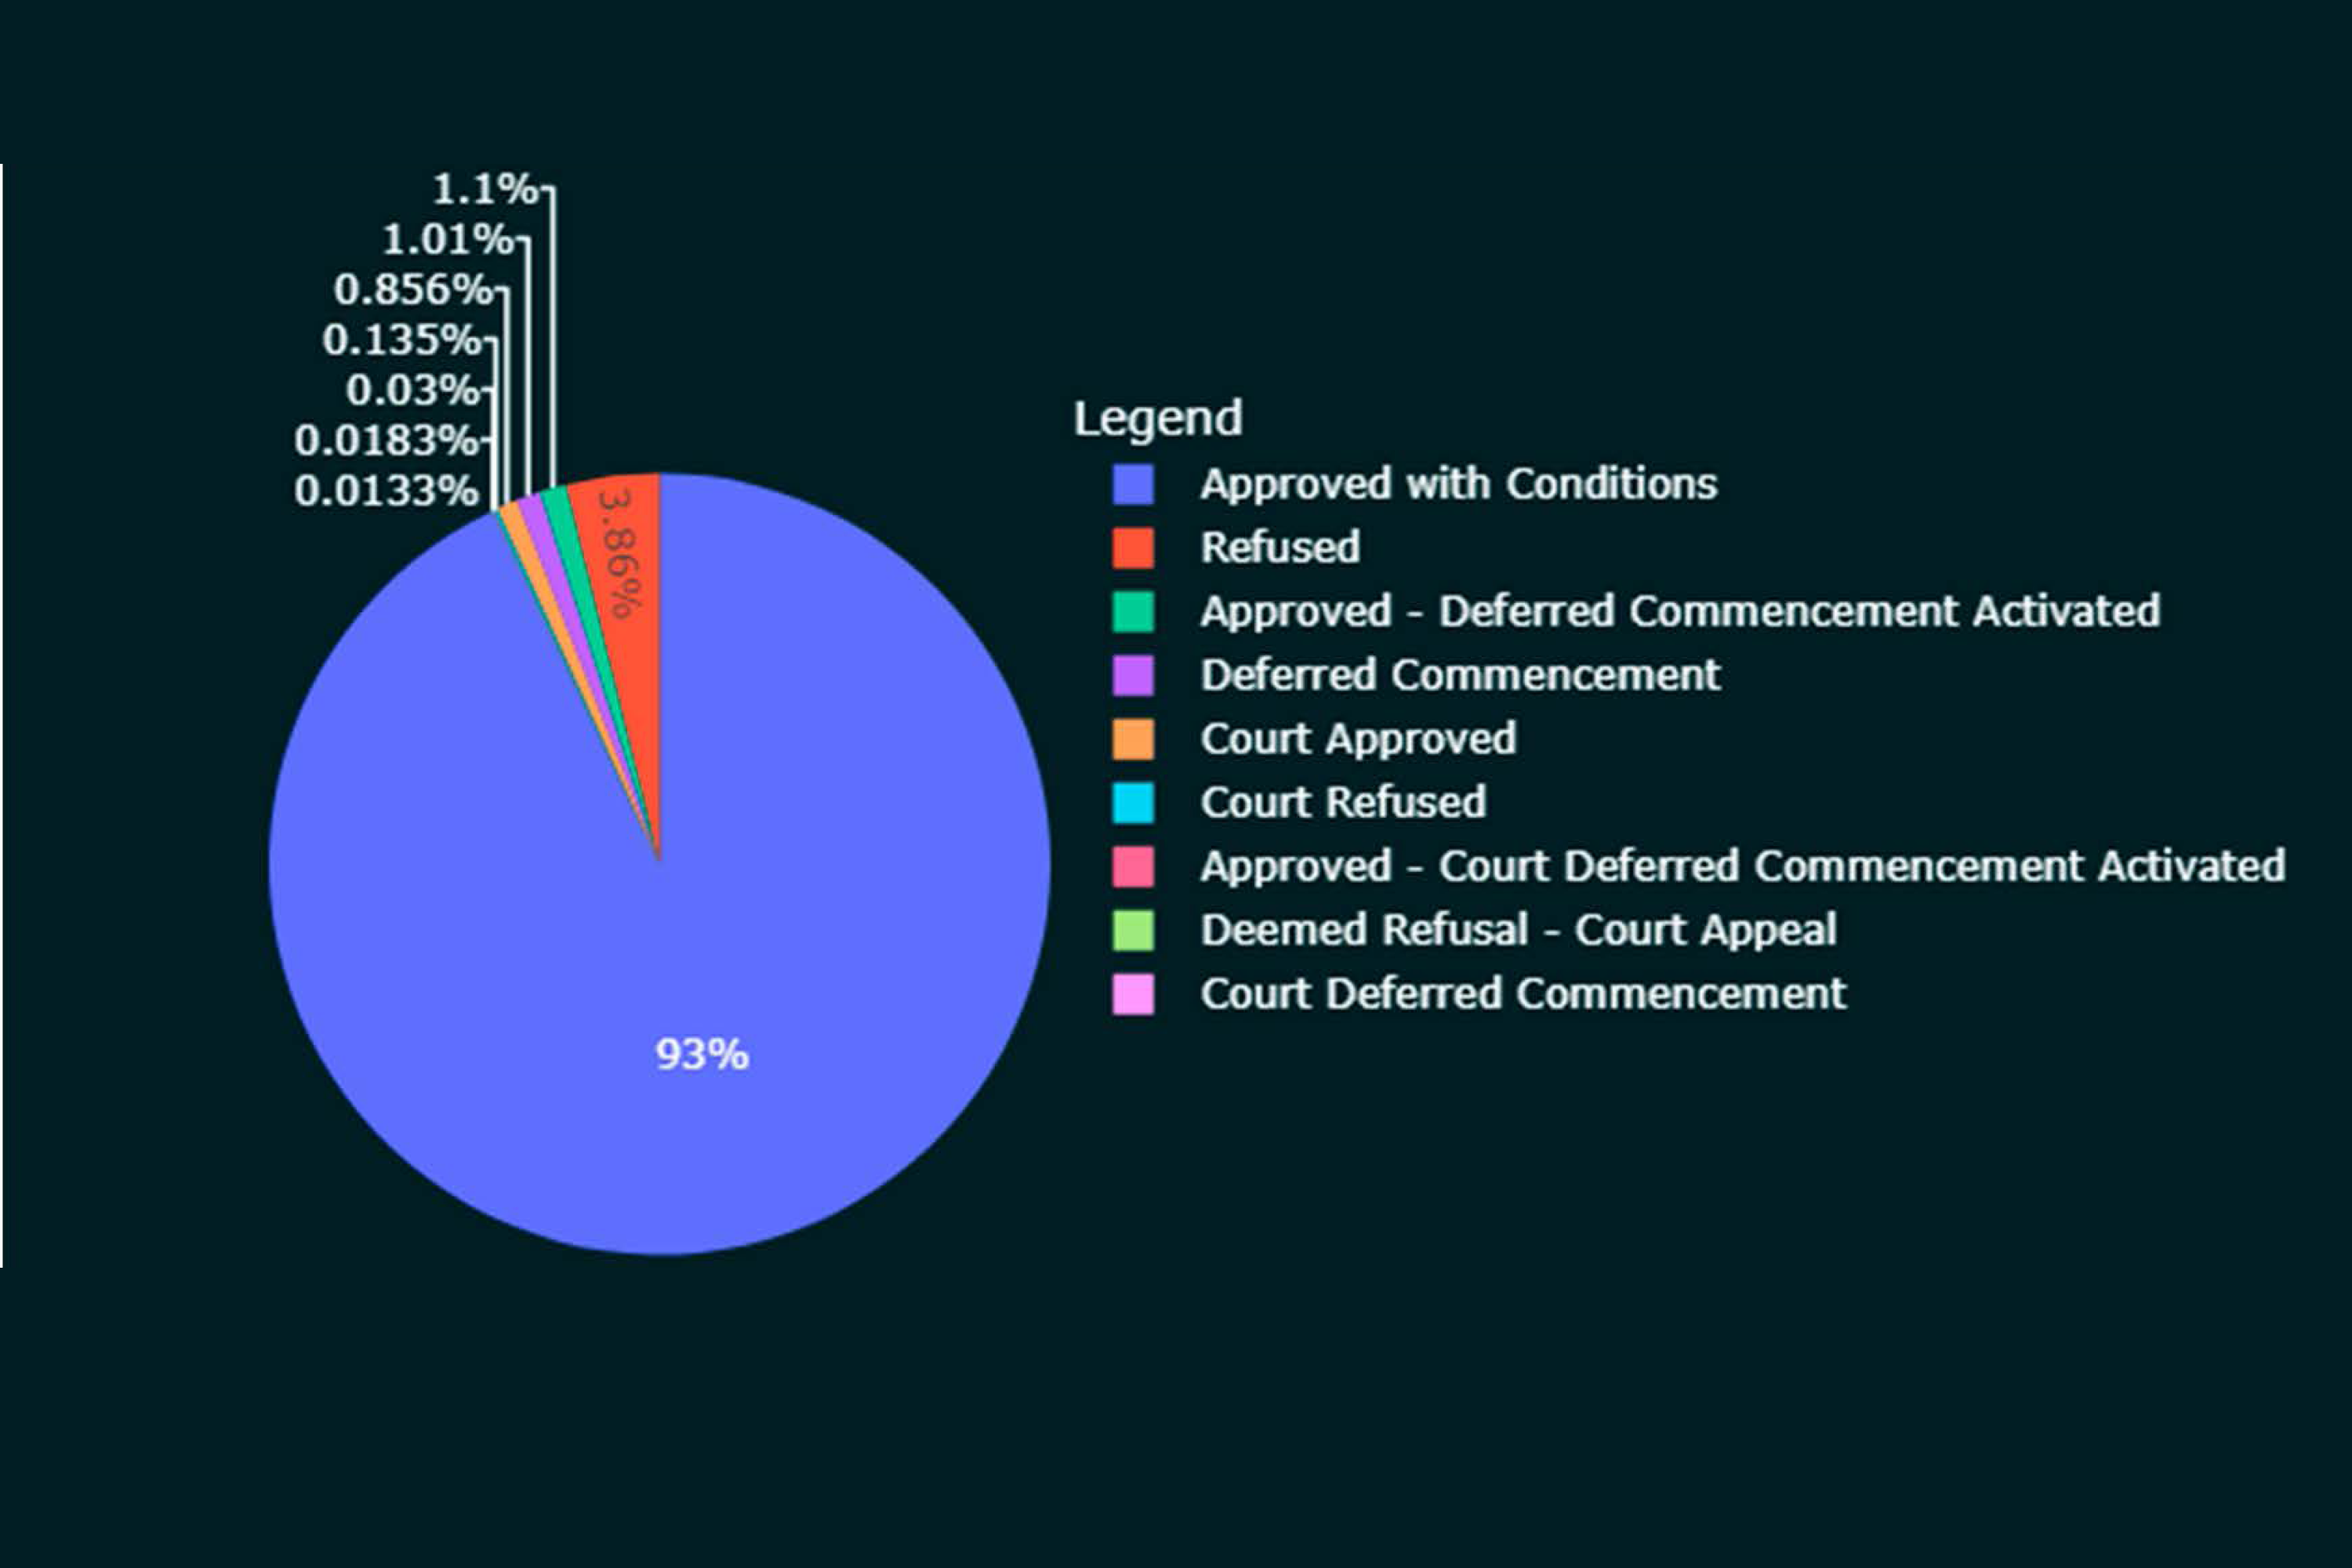
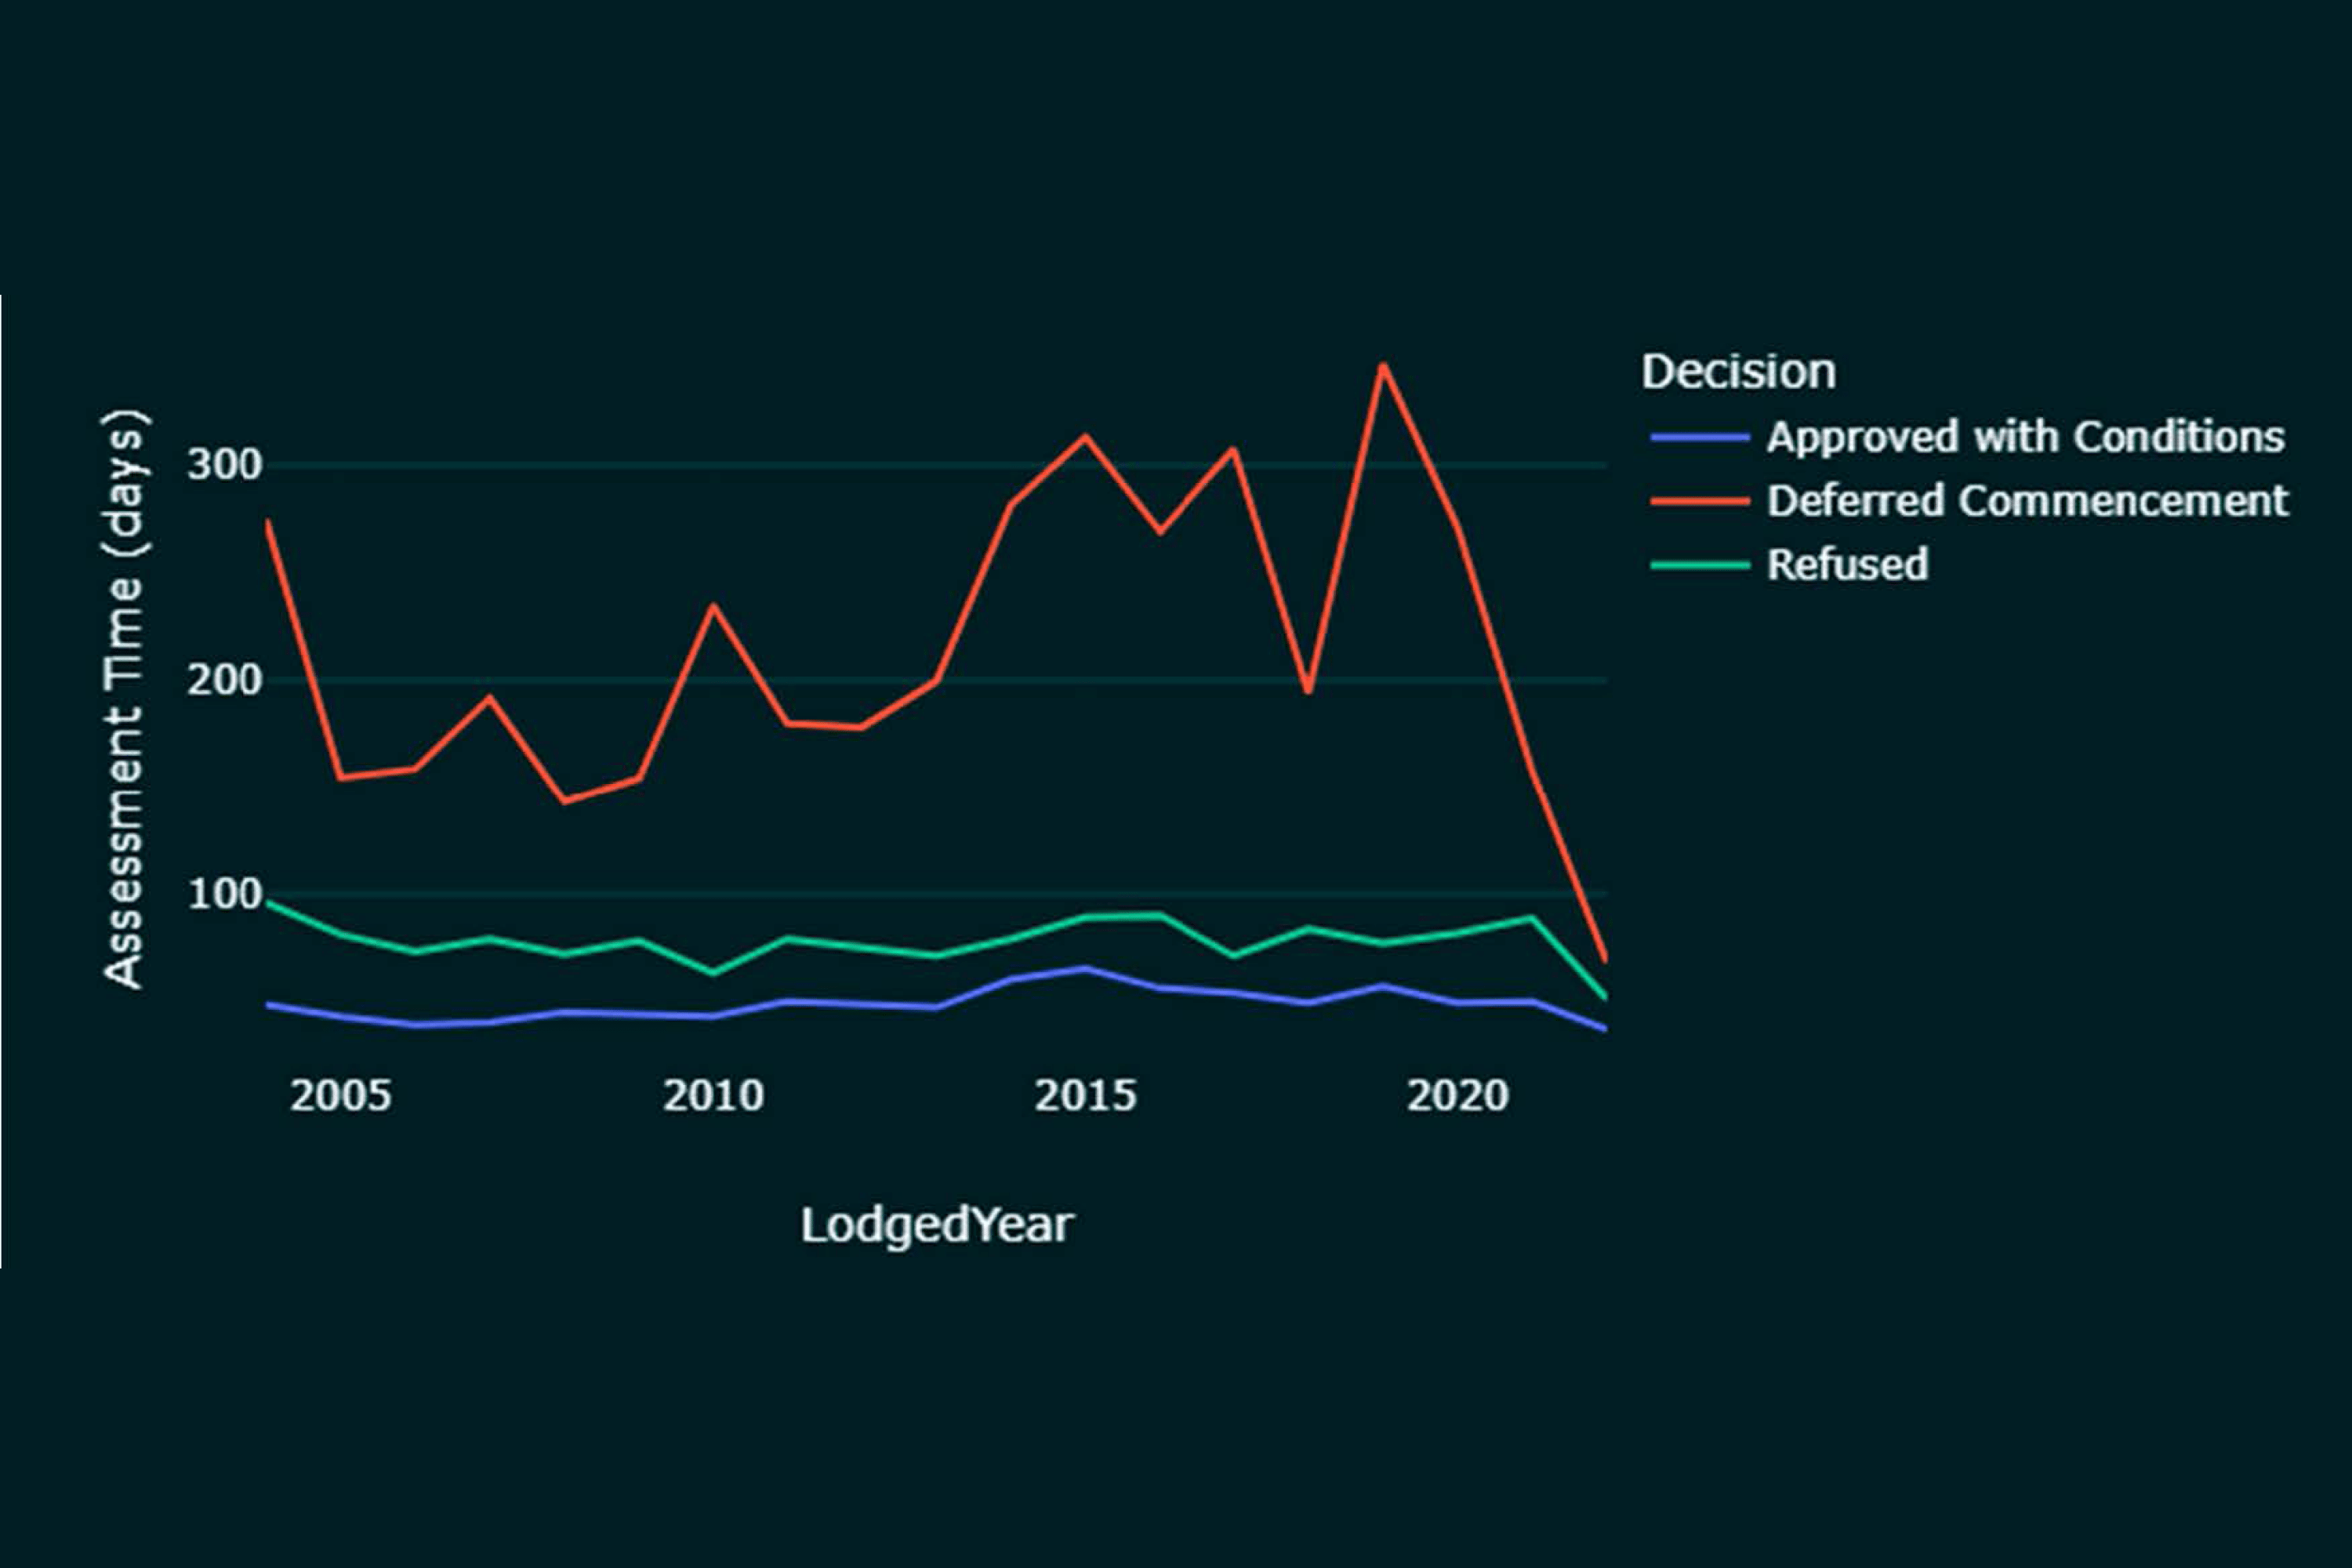
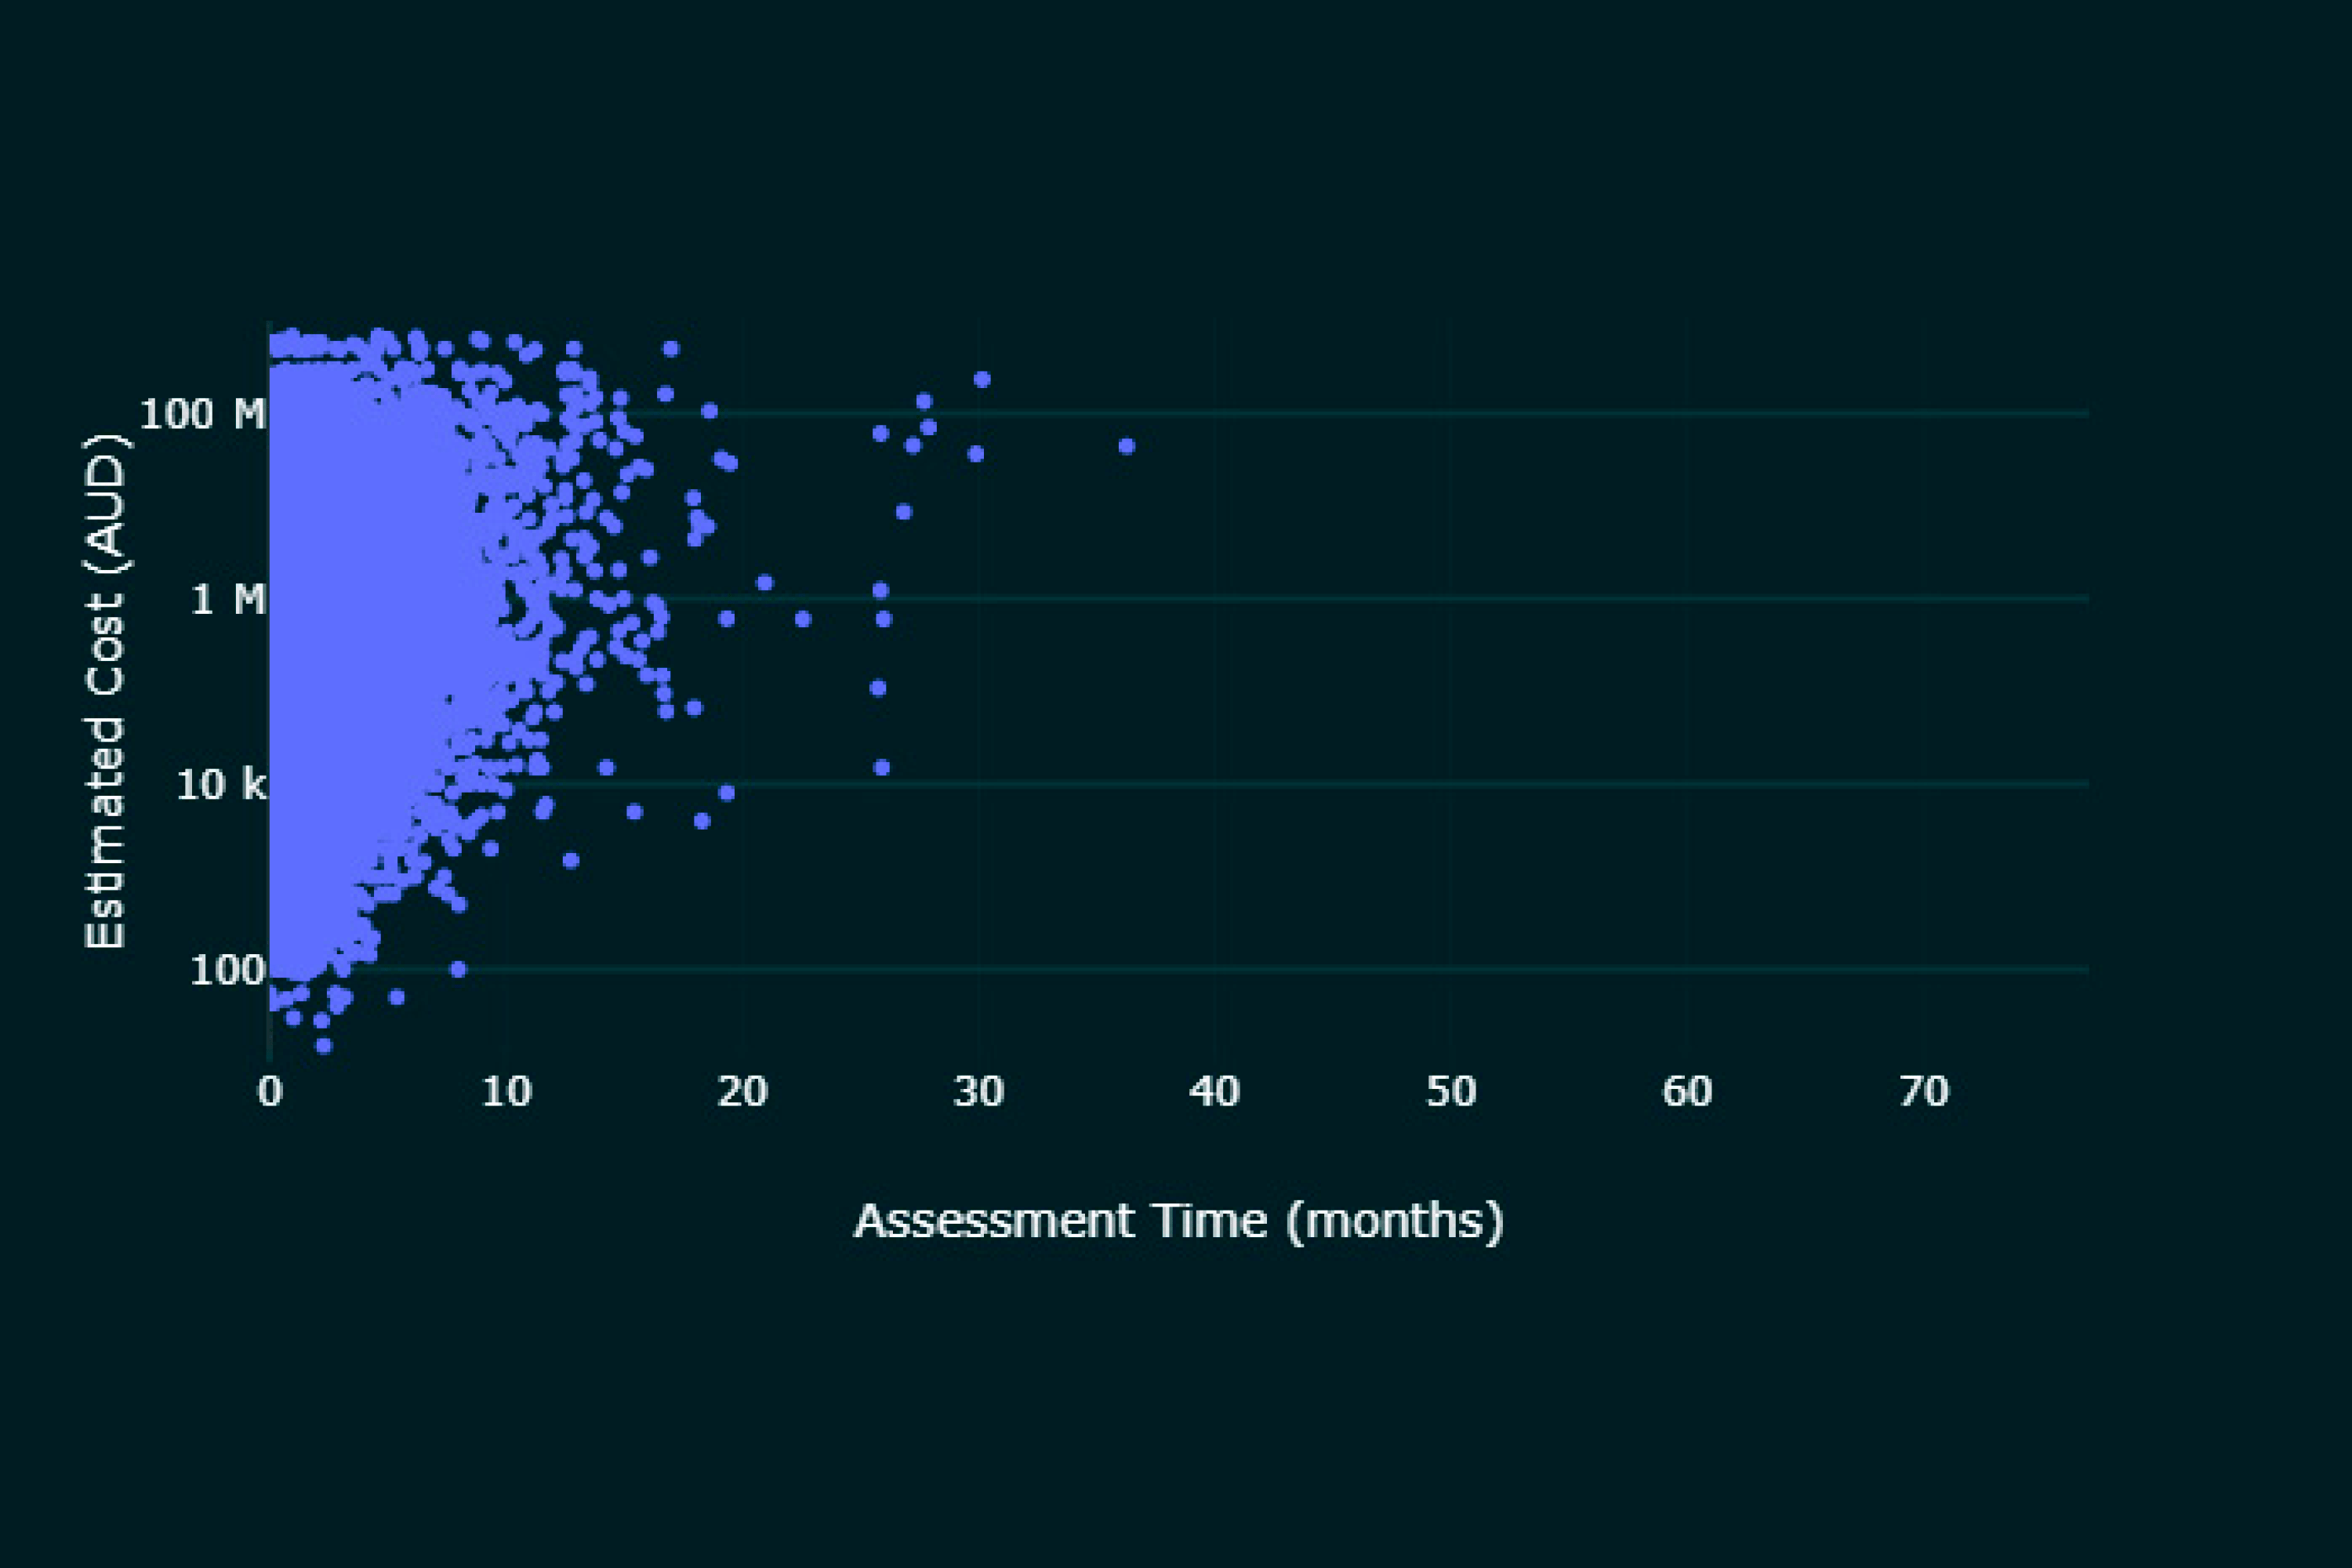
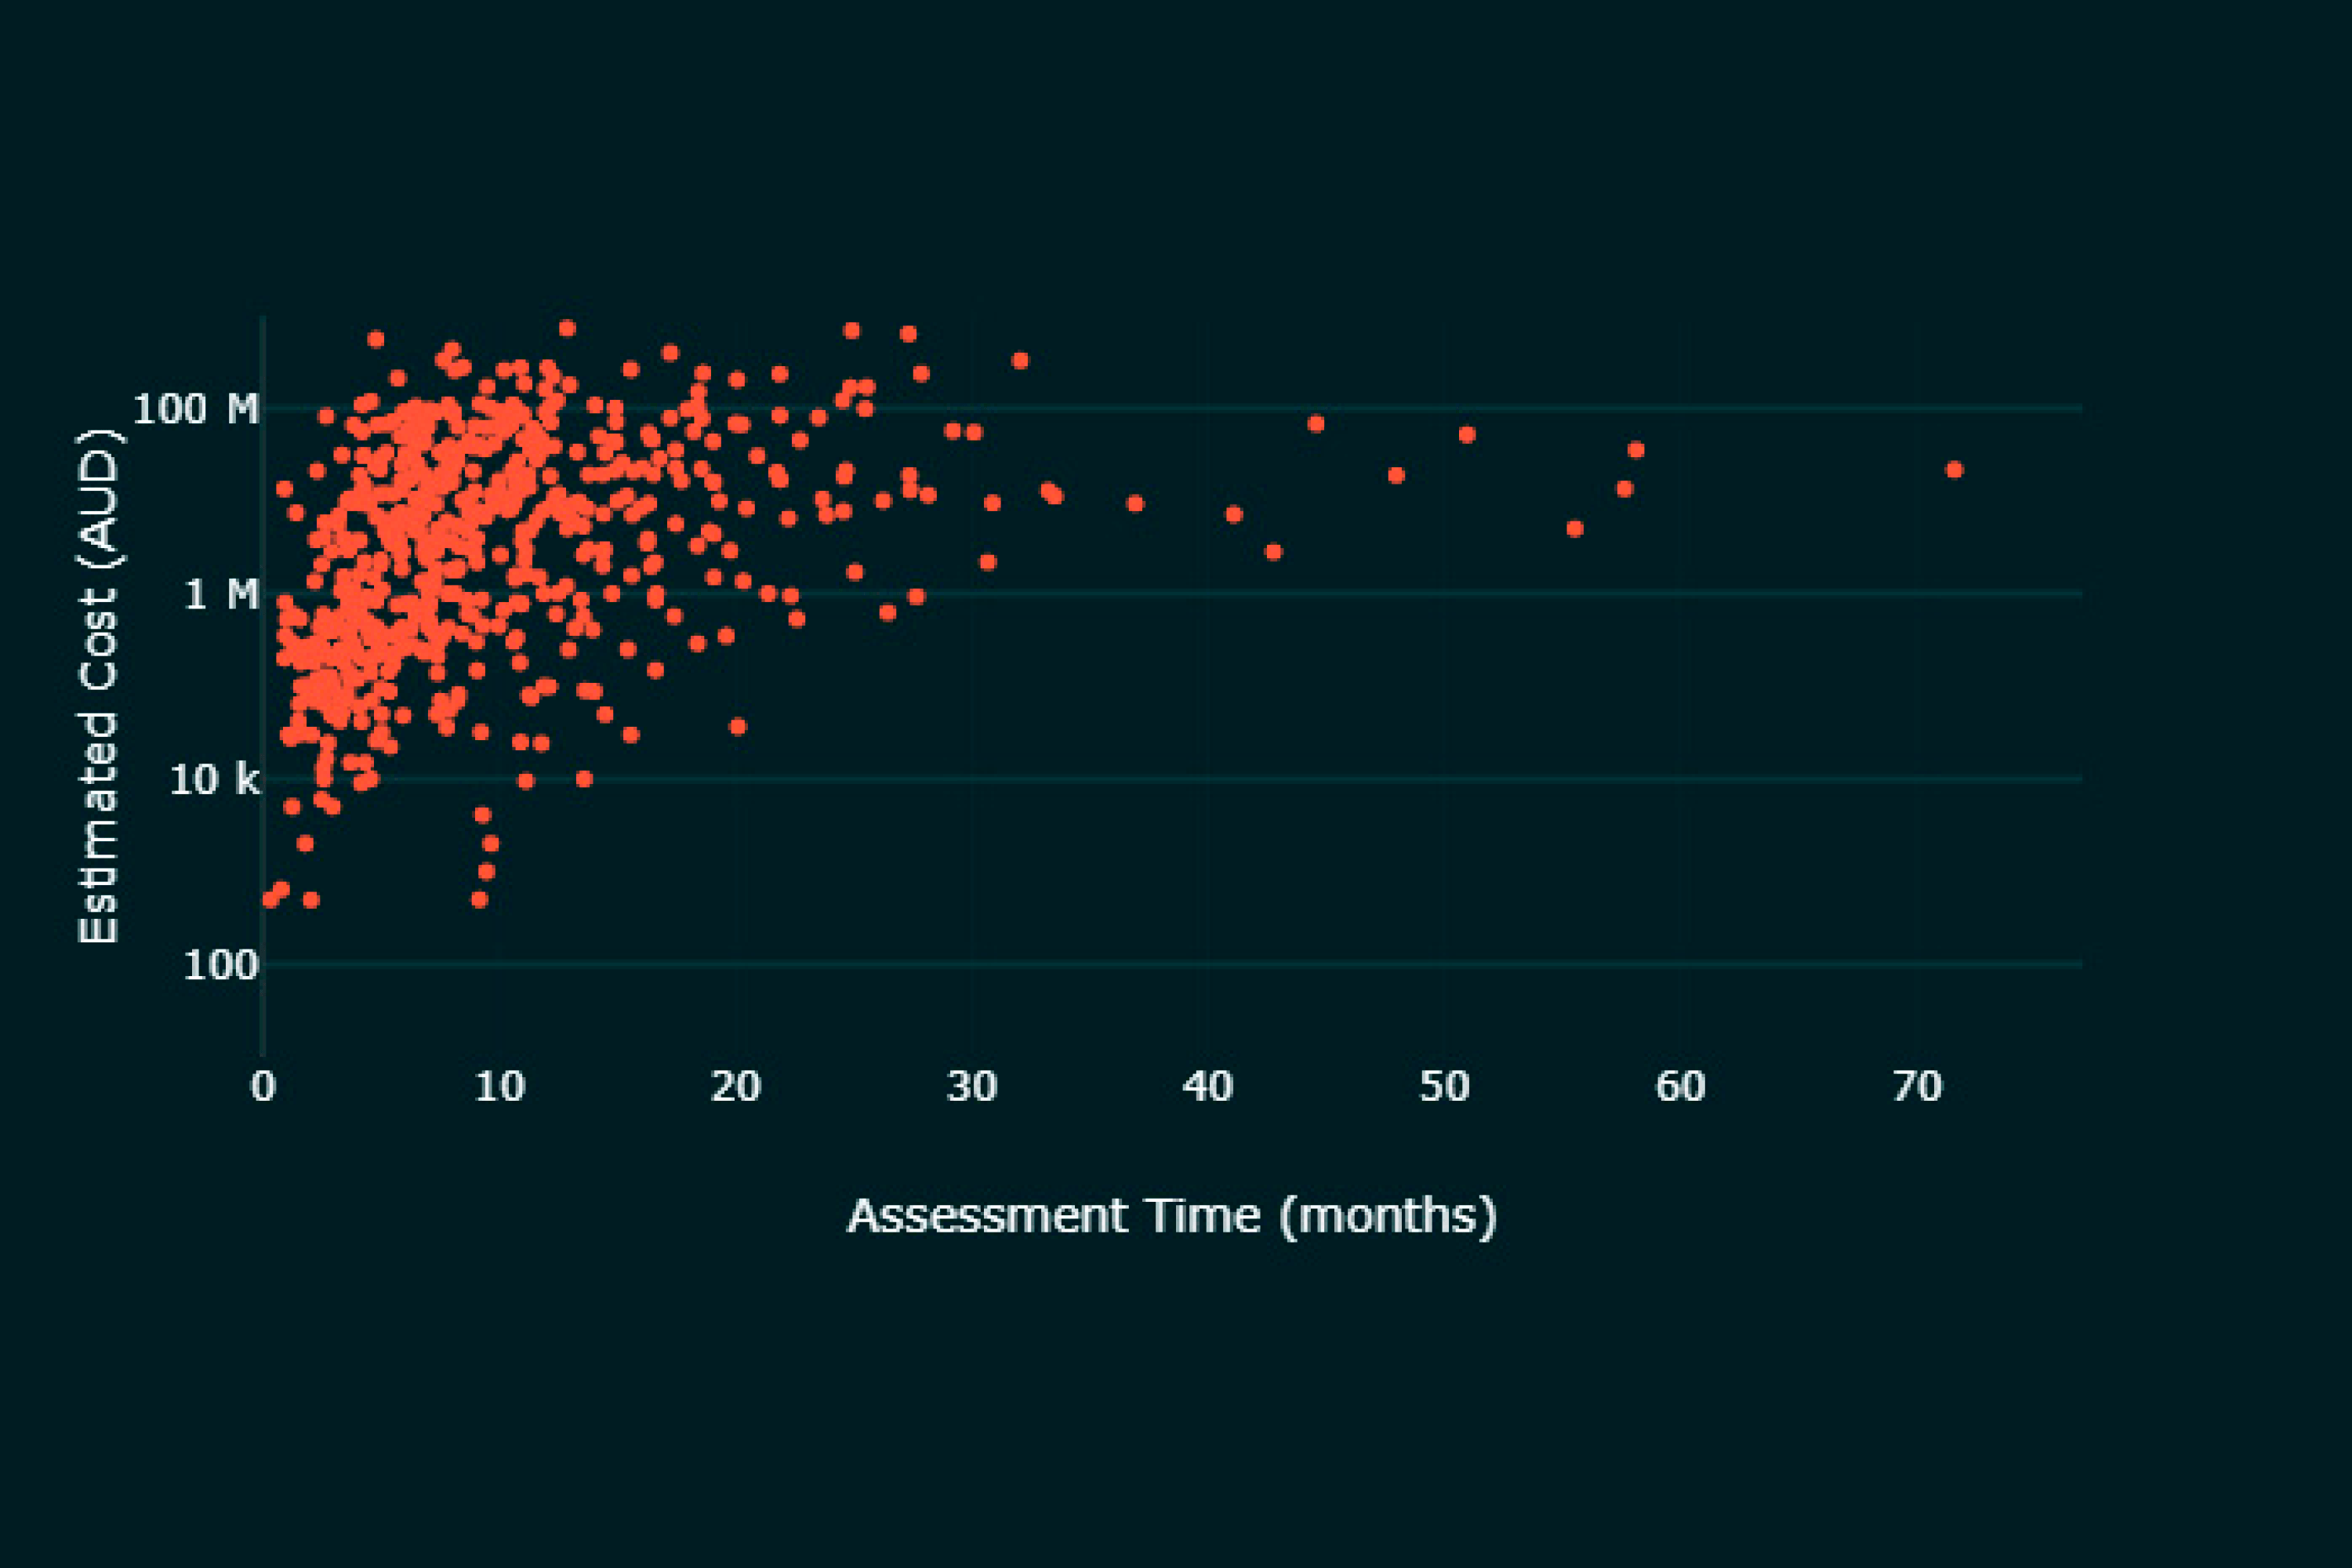
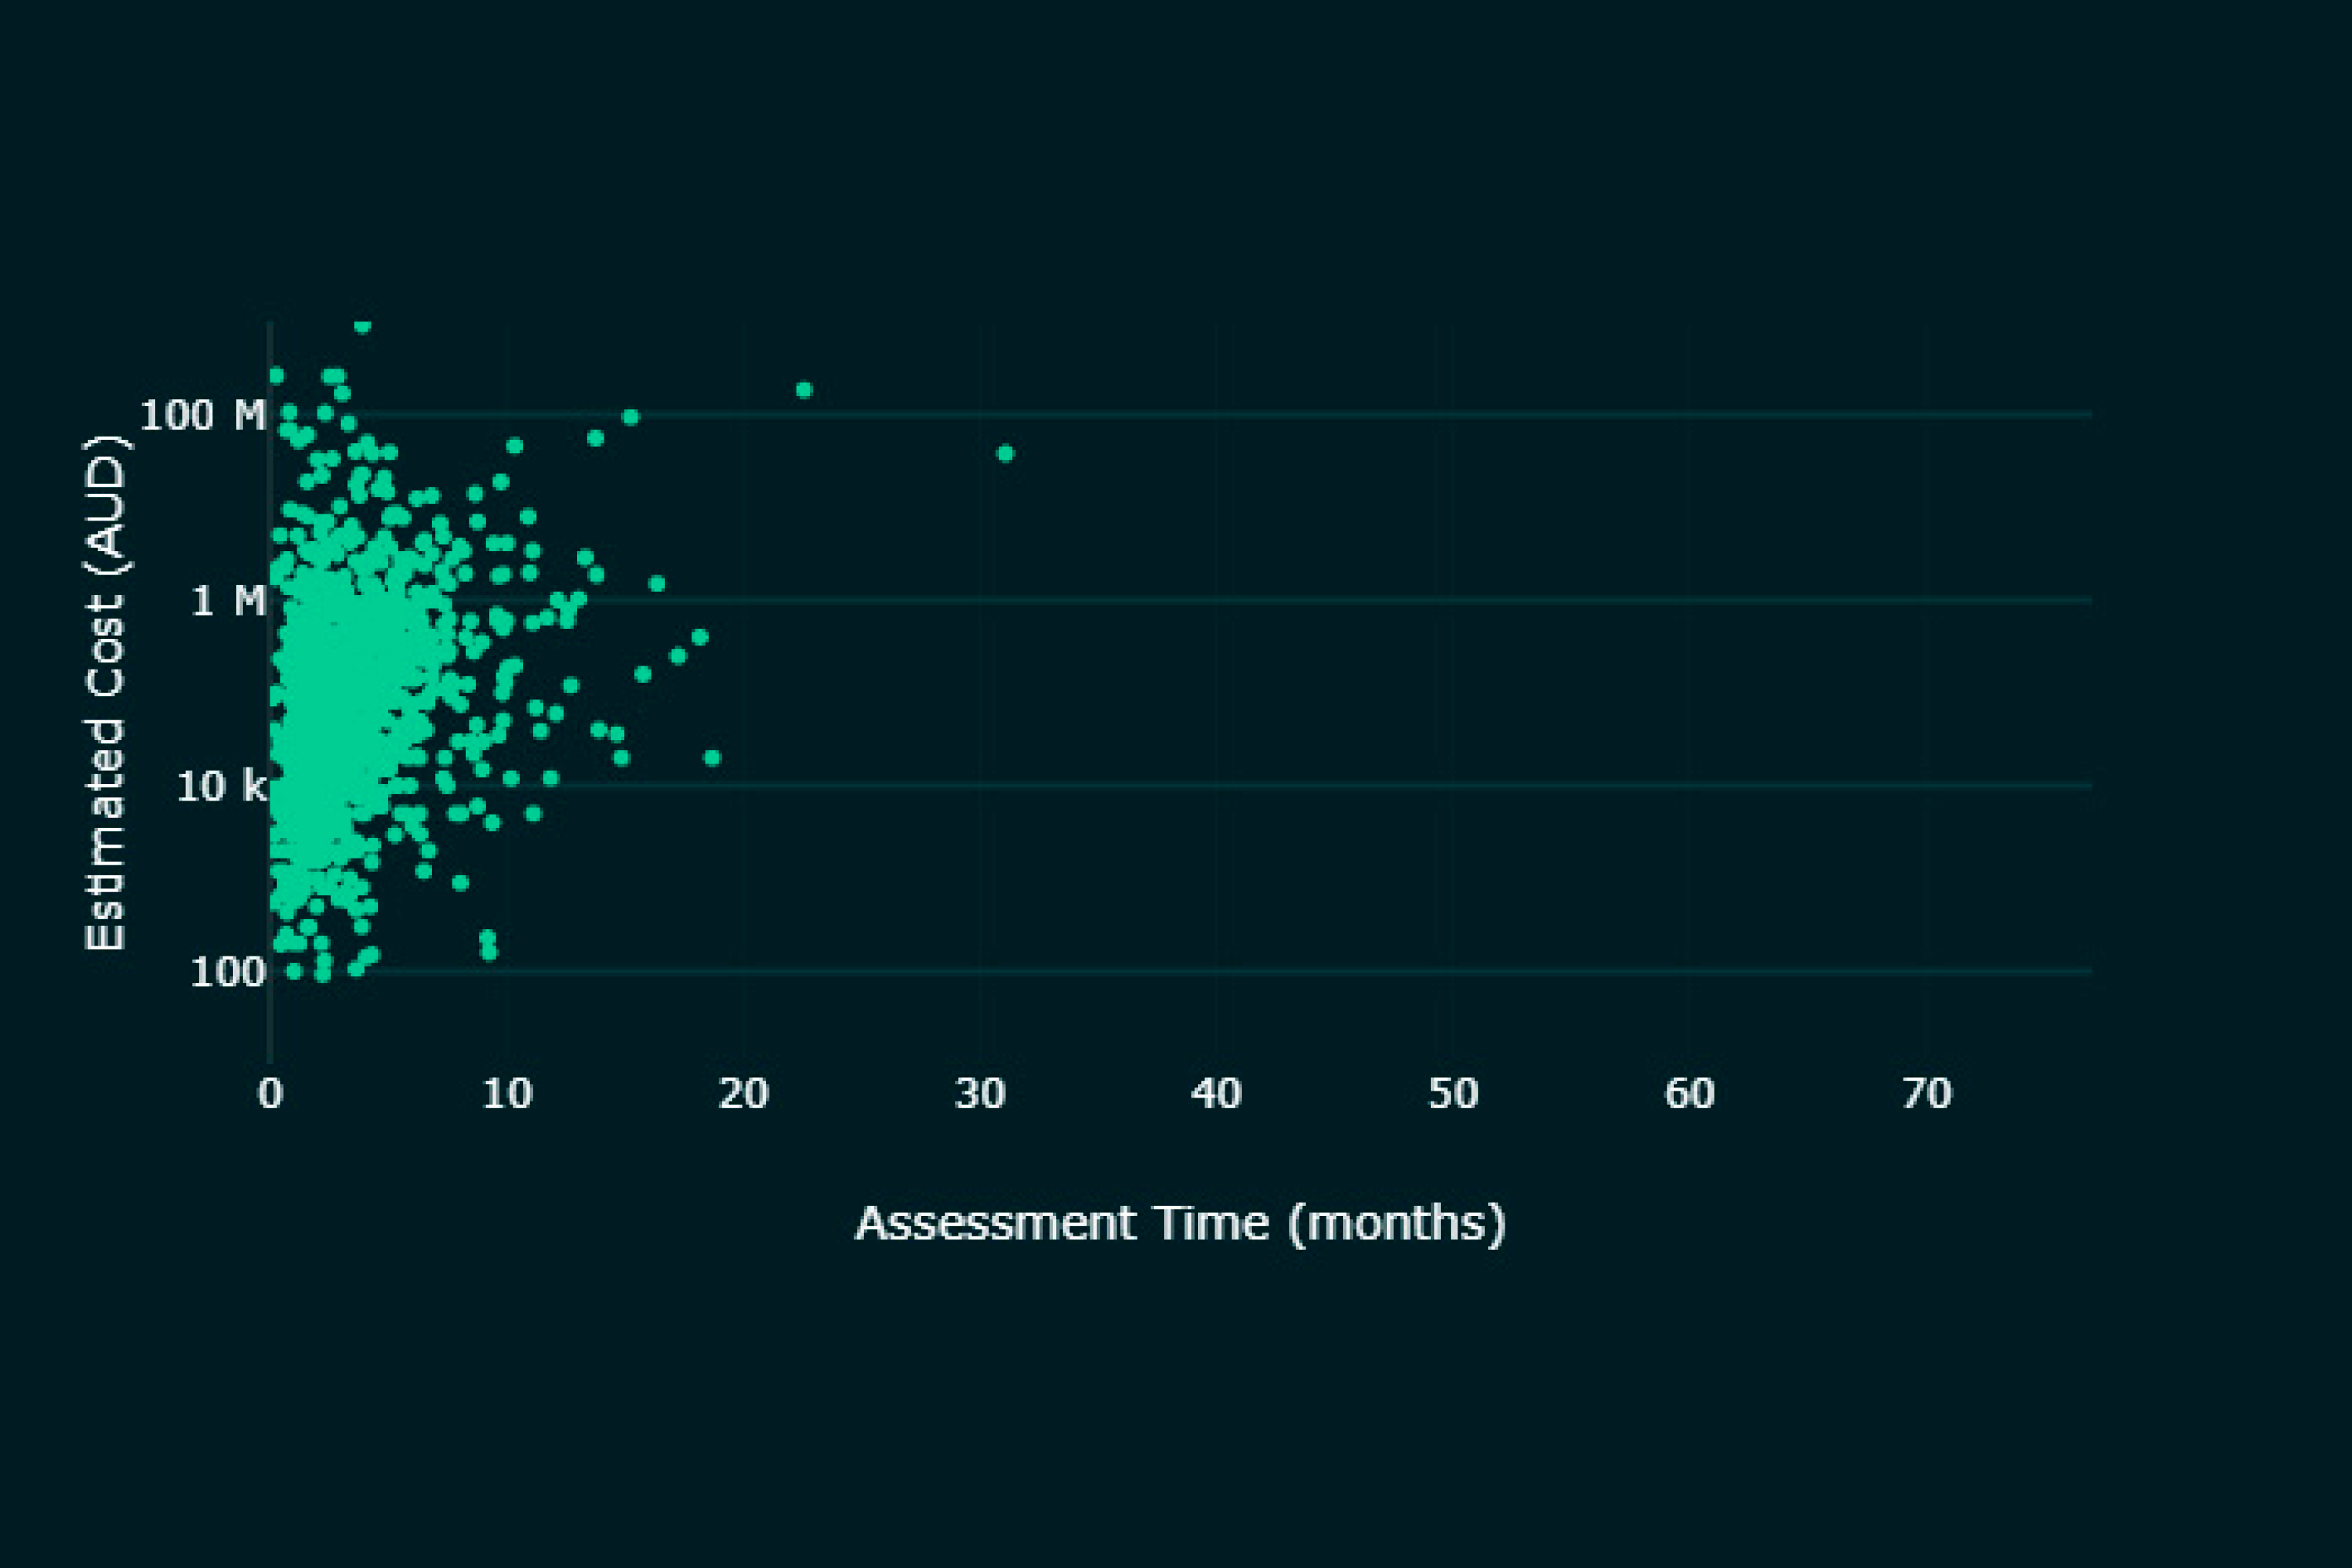
The study of DA assessment time found consistent results and shows that the mean assessment time moved up further in 2015. The development process can still be a significant constraint, with more than 20% of developments requiring more than three months to be reviewed. On the bright side, almost 30% of developments are now reviewed under a month, and 4.24% under a week. While there is a positive correlation between estimated cost and assessment time, it was found that a significant number of high-value DAs were assessed with only short delays. Overall, 94% of developments are approved by the Council.

Further data would be required to understand the factors that influence the assessment time of specific DAs. One hypothesis to be explored in future research could be that sharing more development information as open data could result in better-prepared DAs and lessen the review load on the Council.

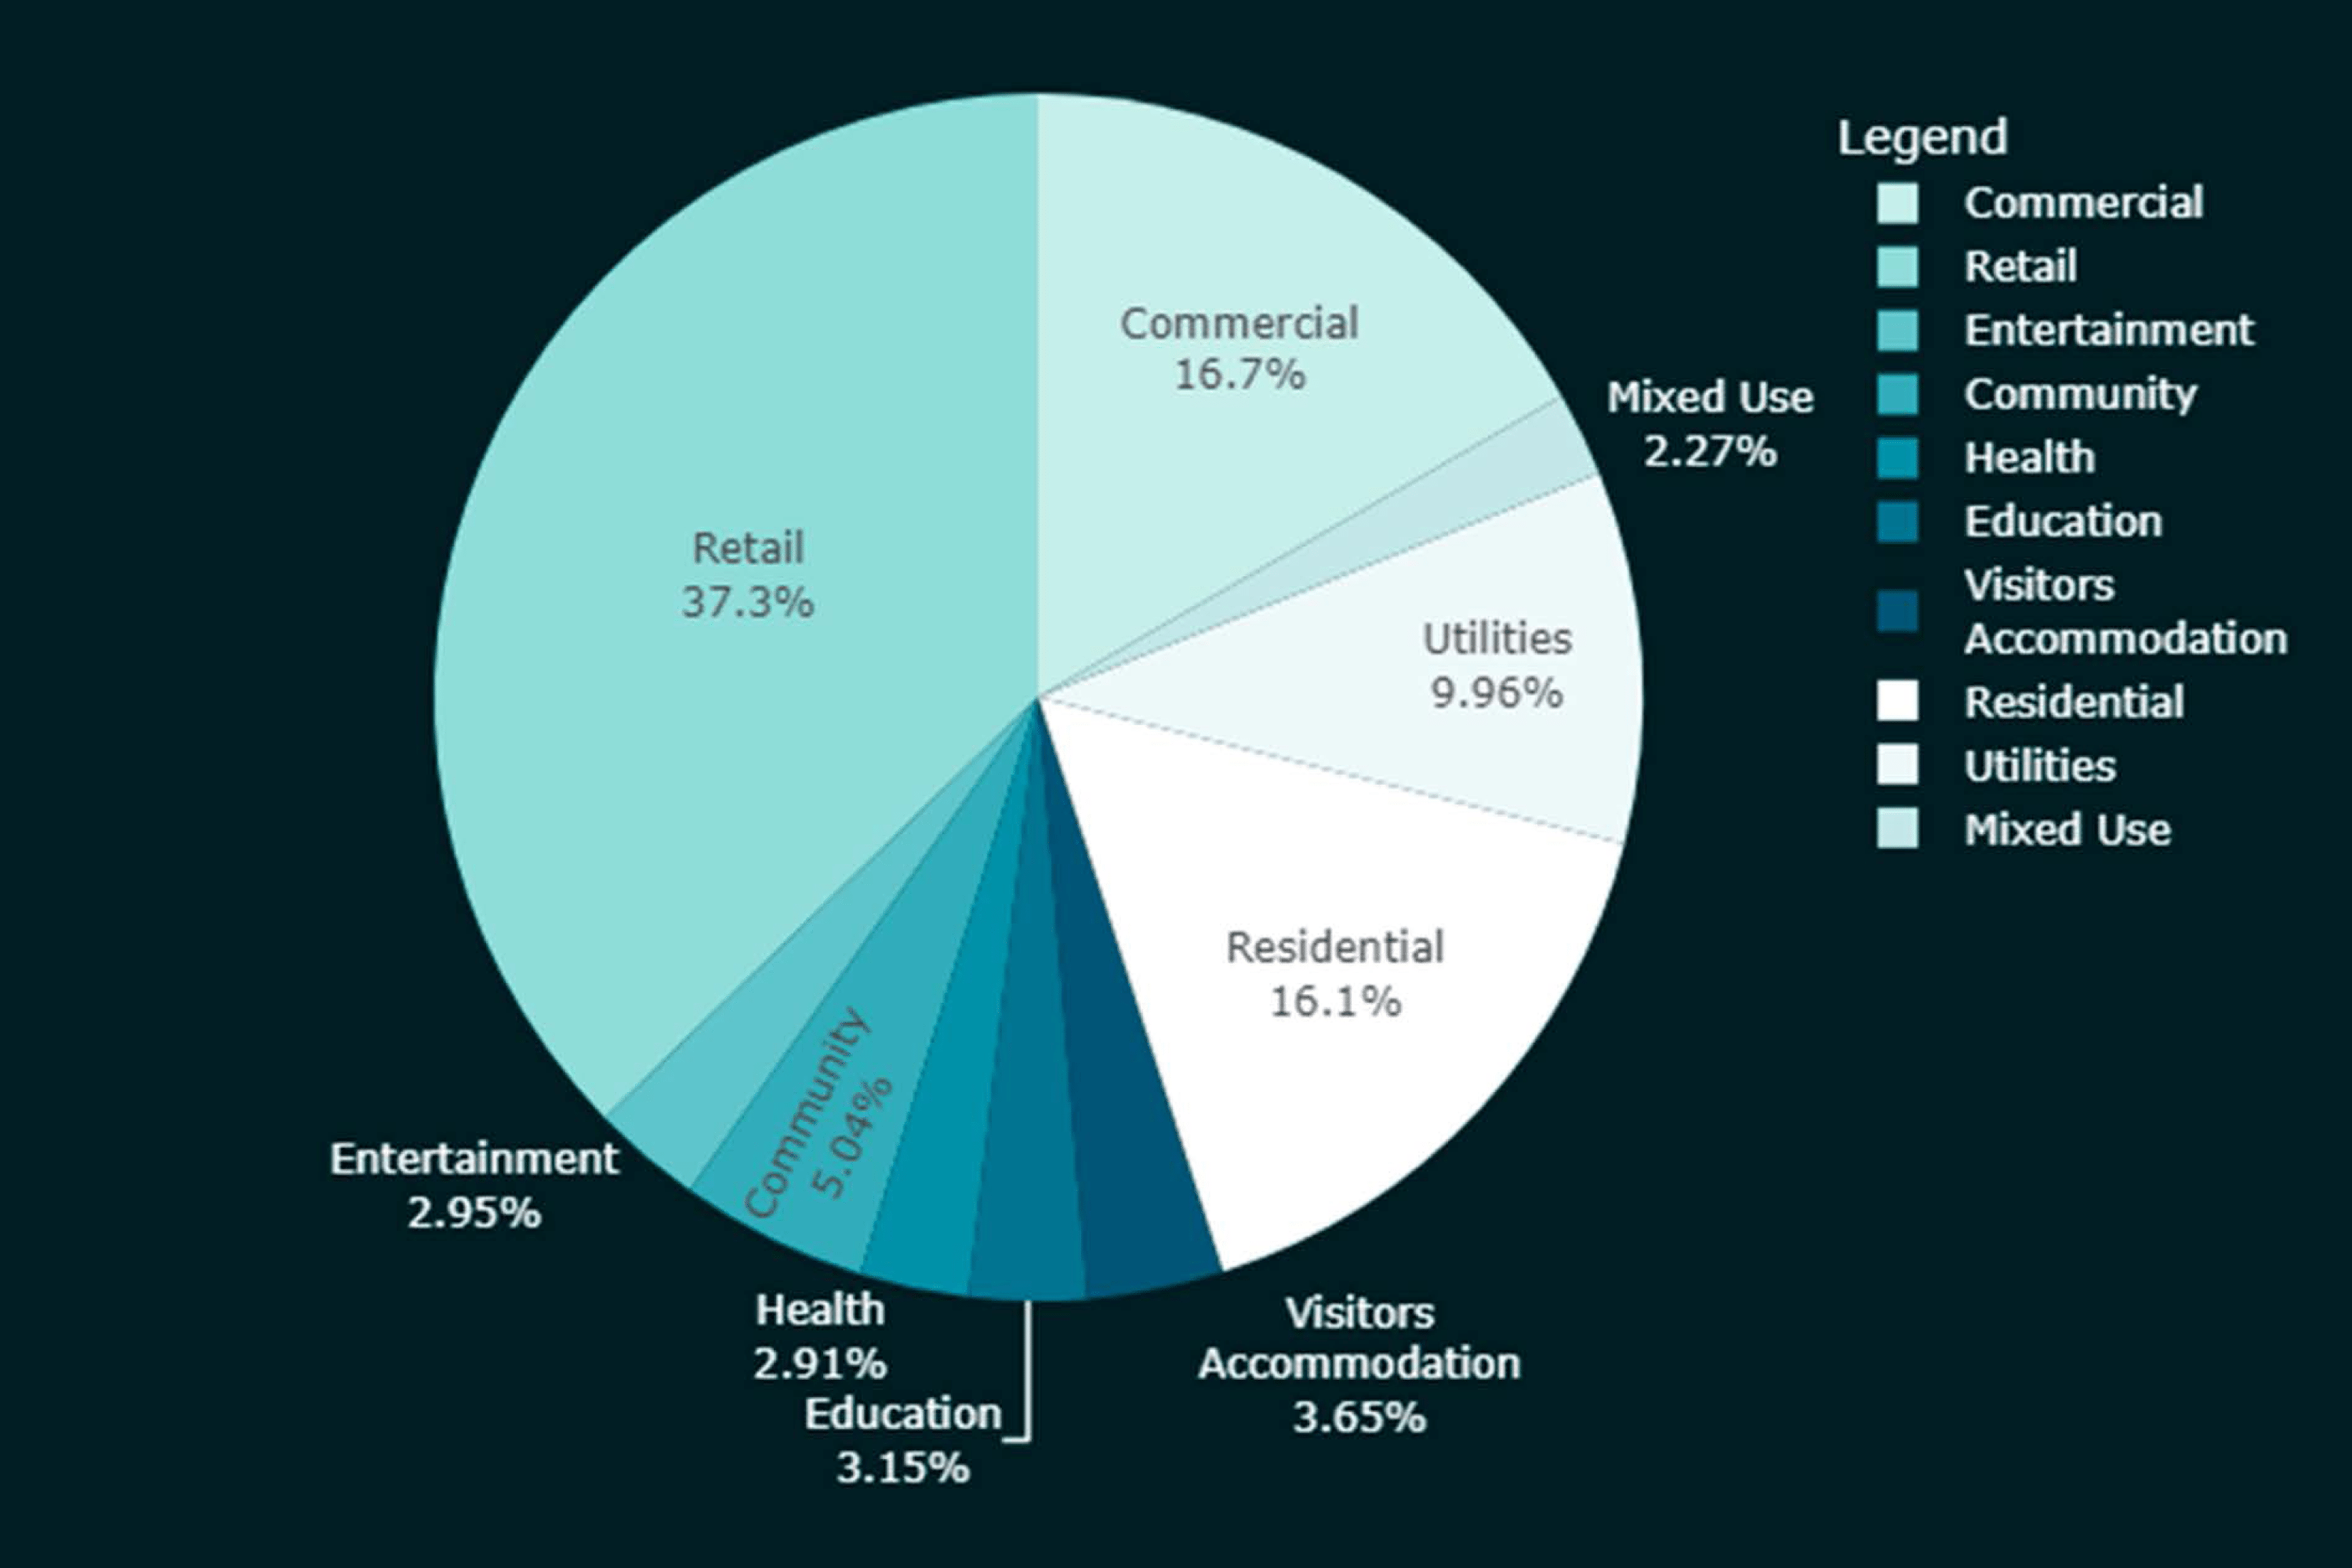
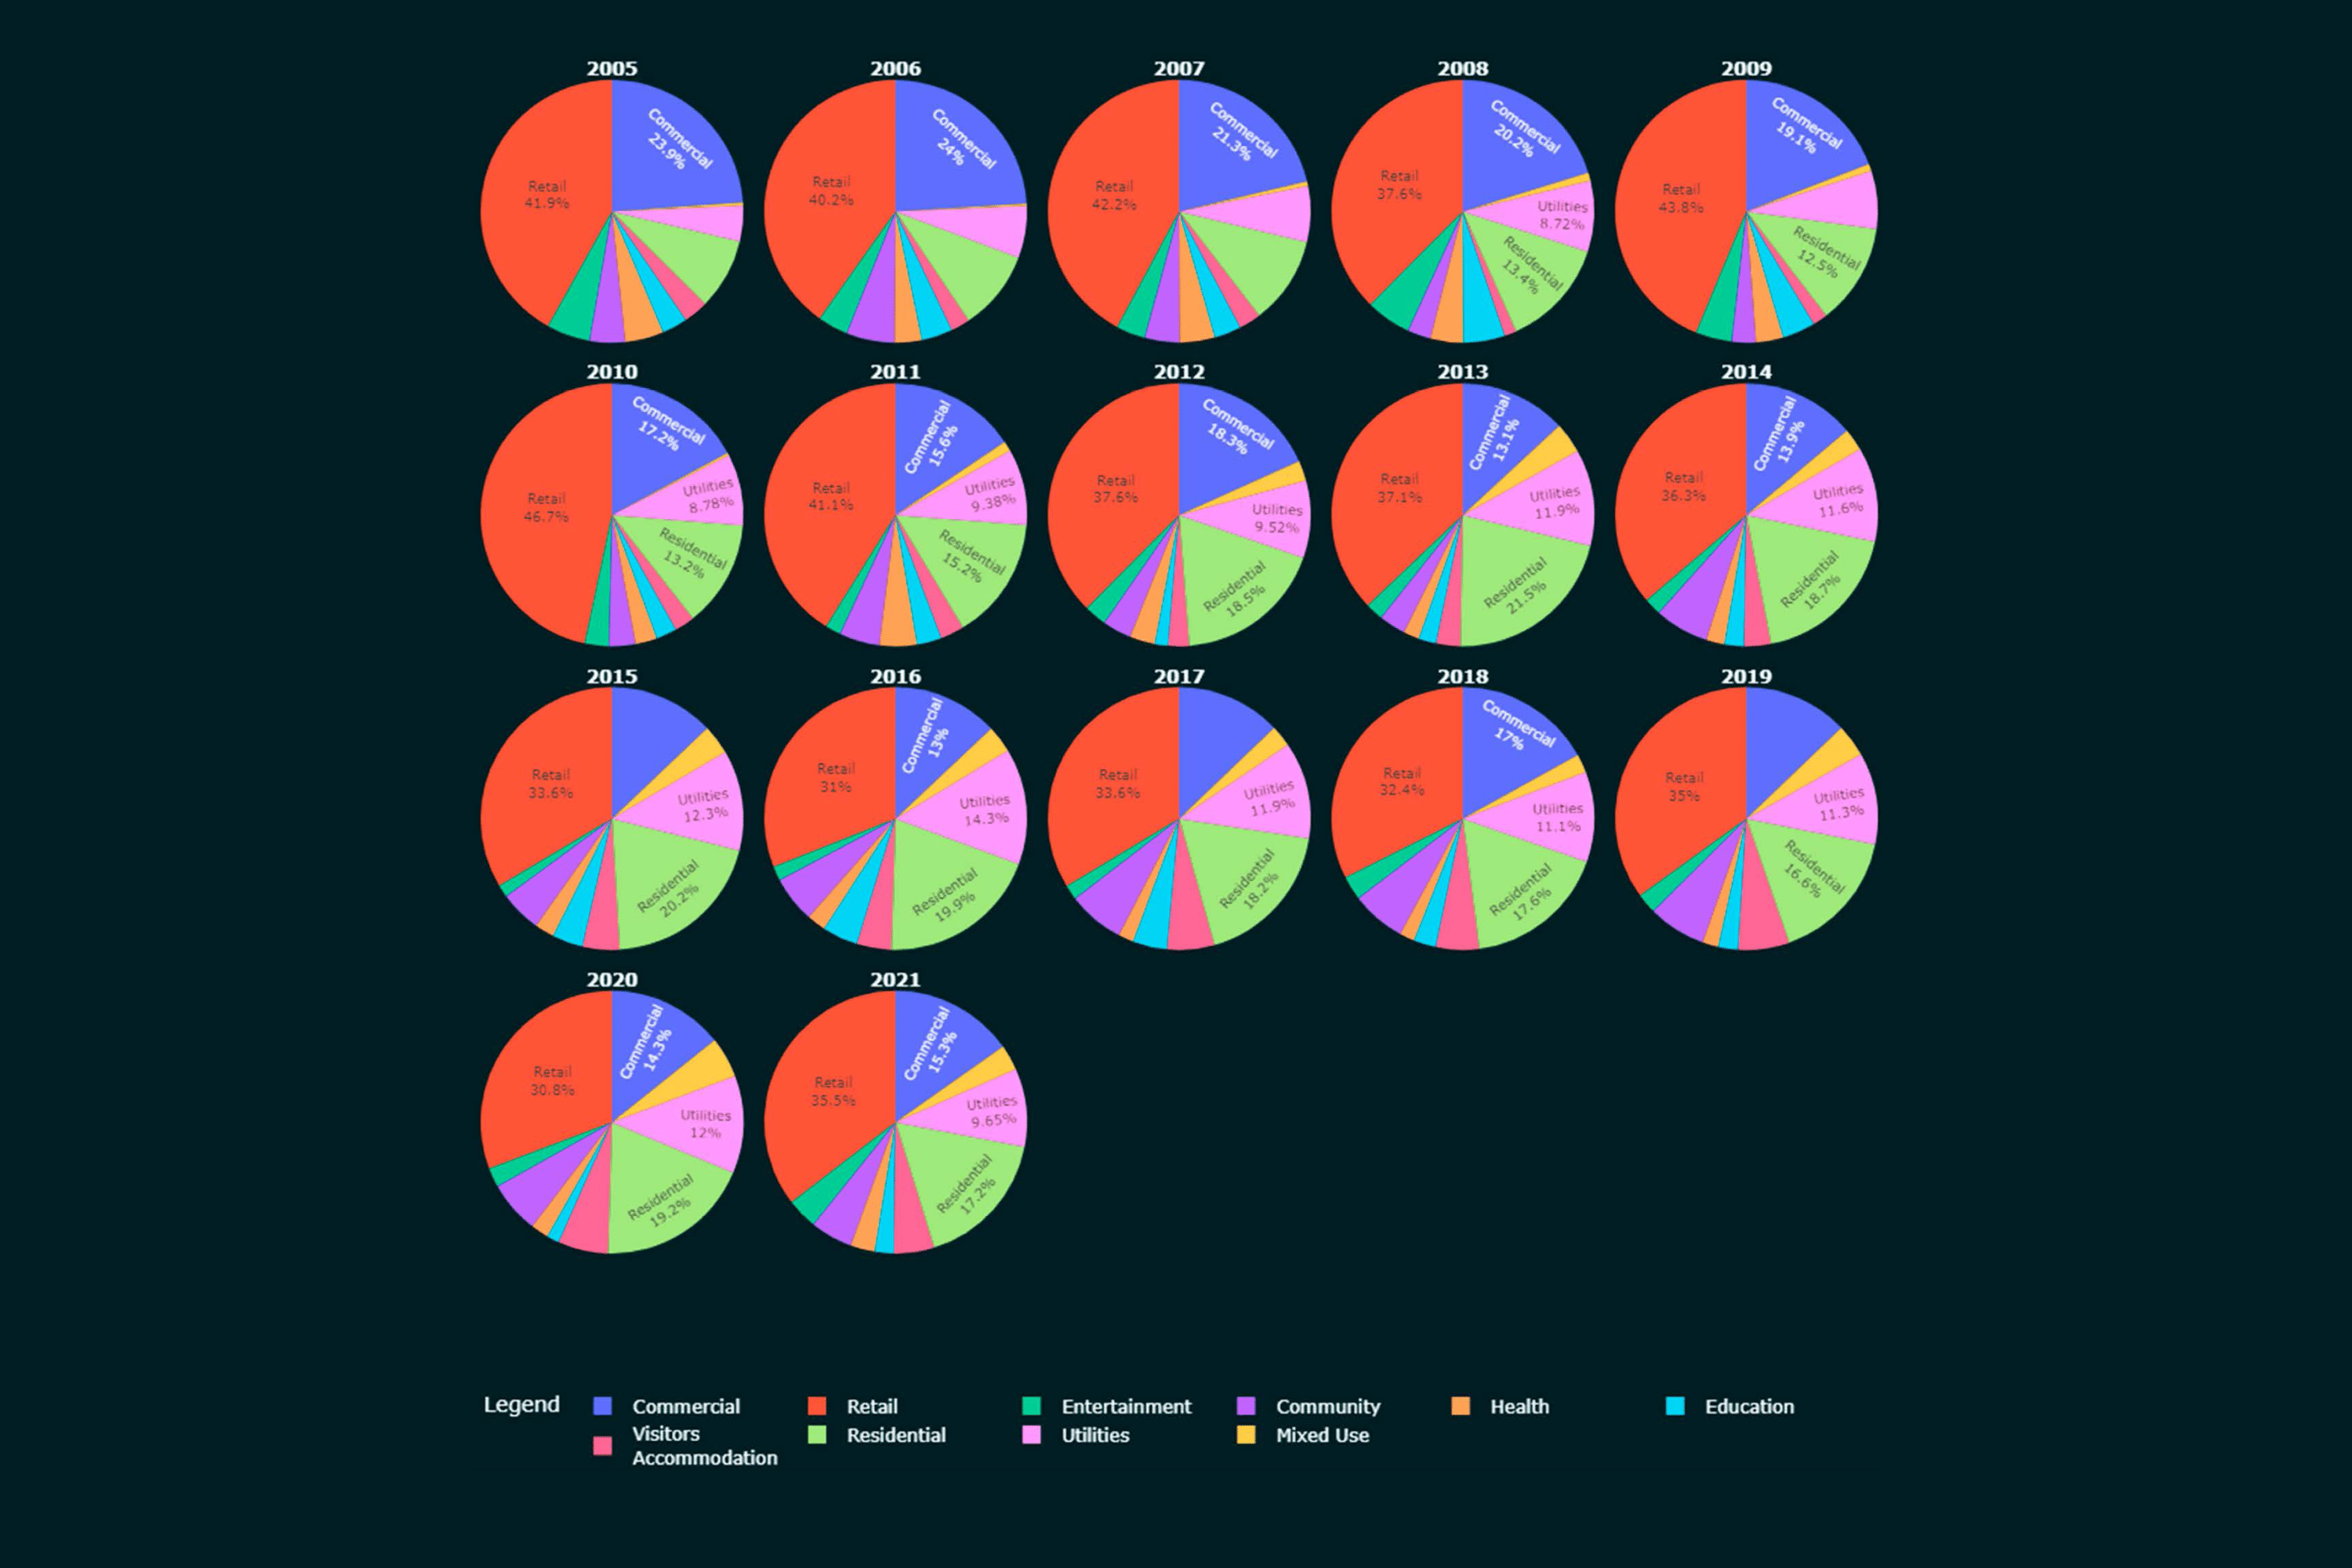
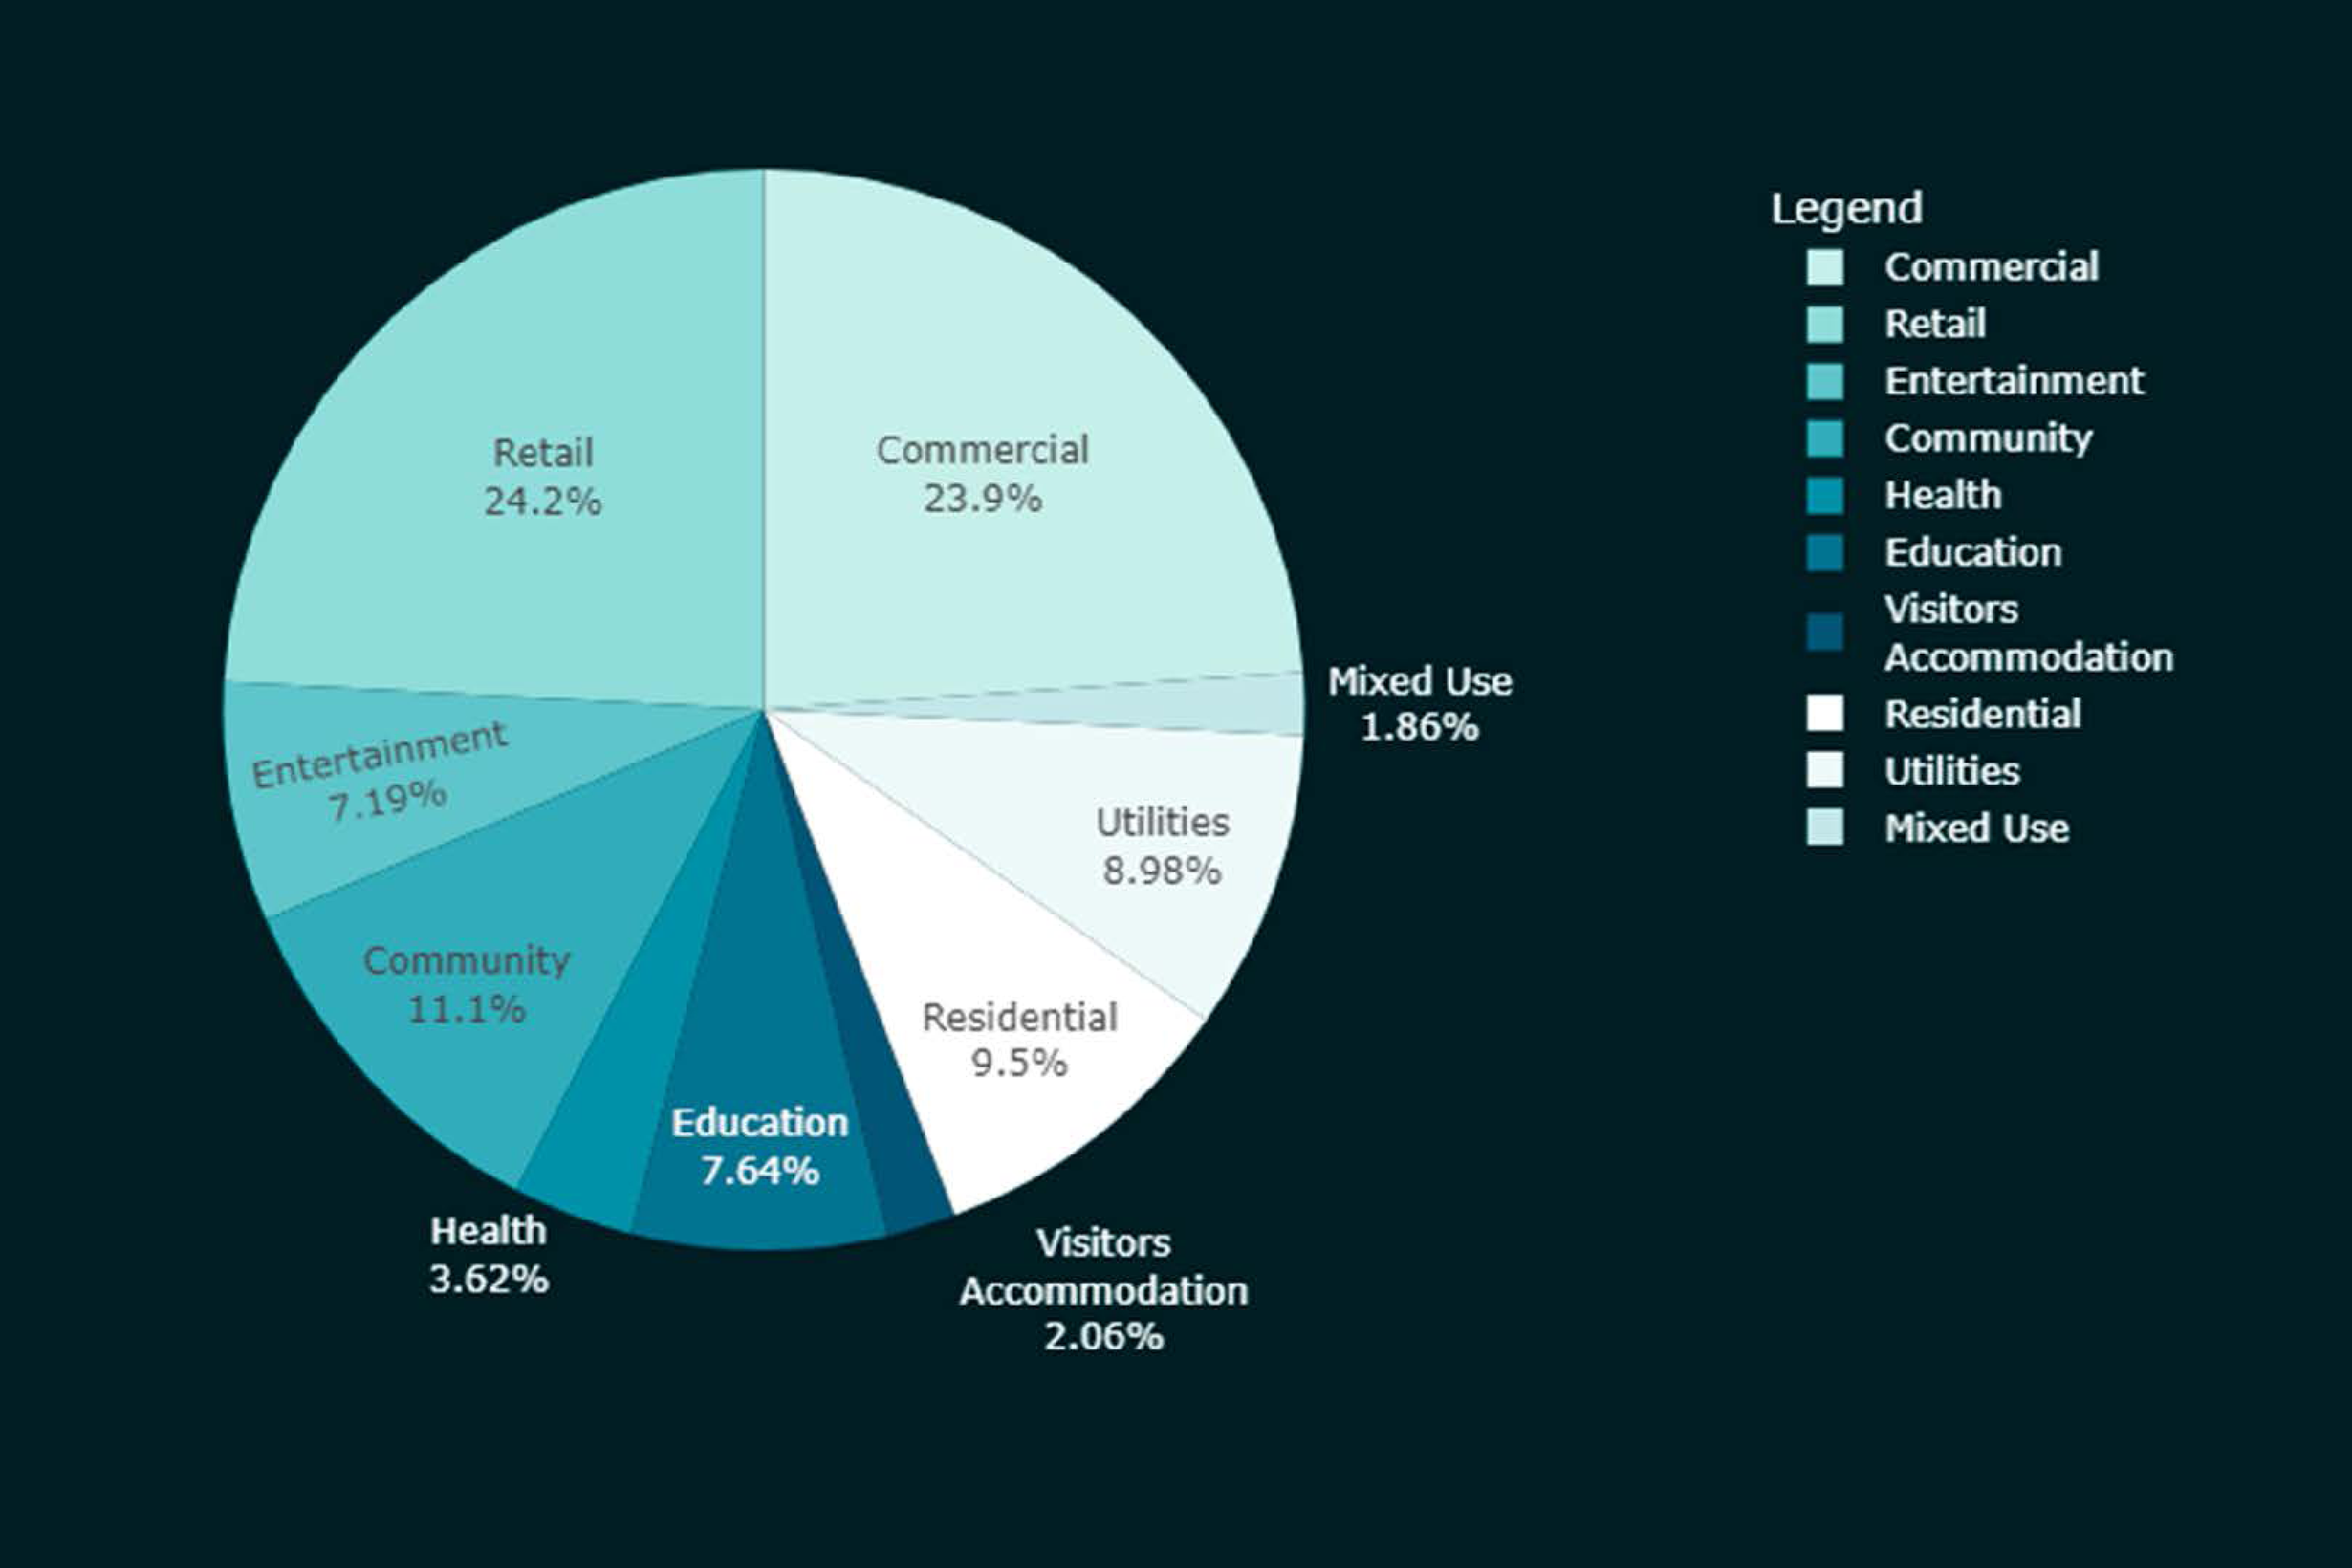
Evolving Uses as an Indicator of Changing Community Needs

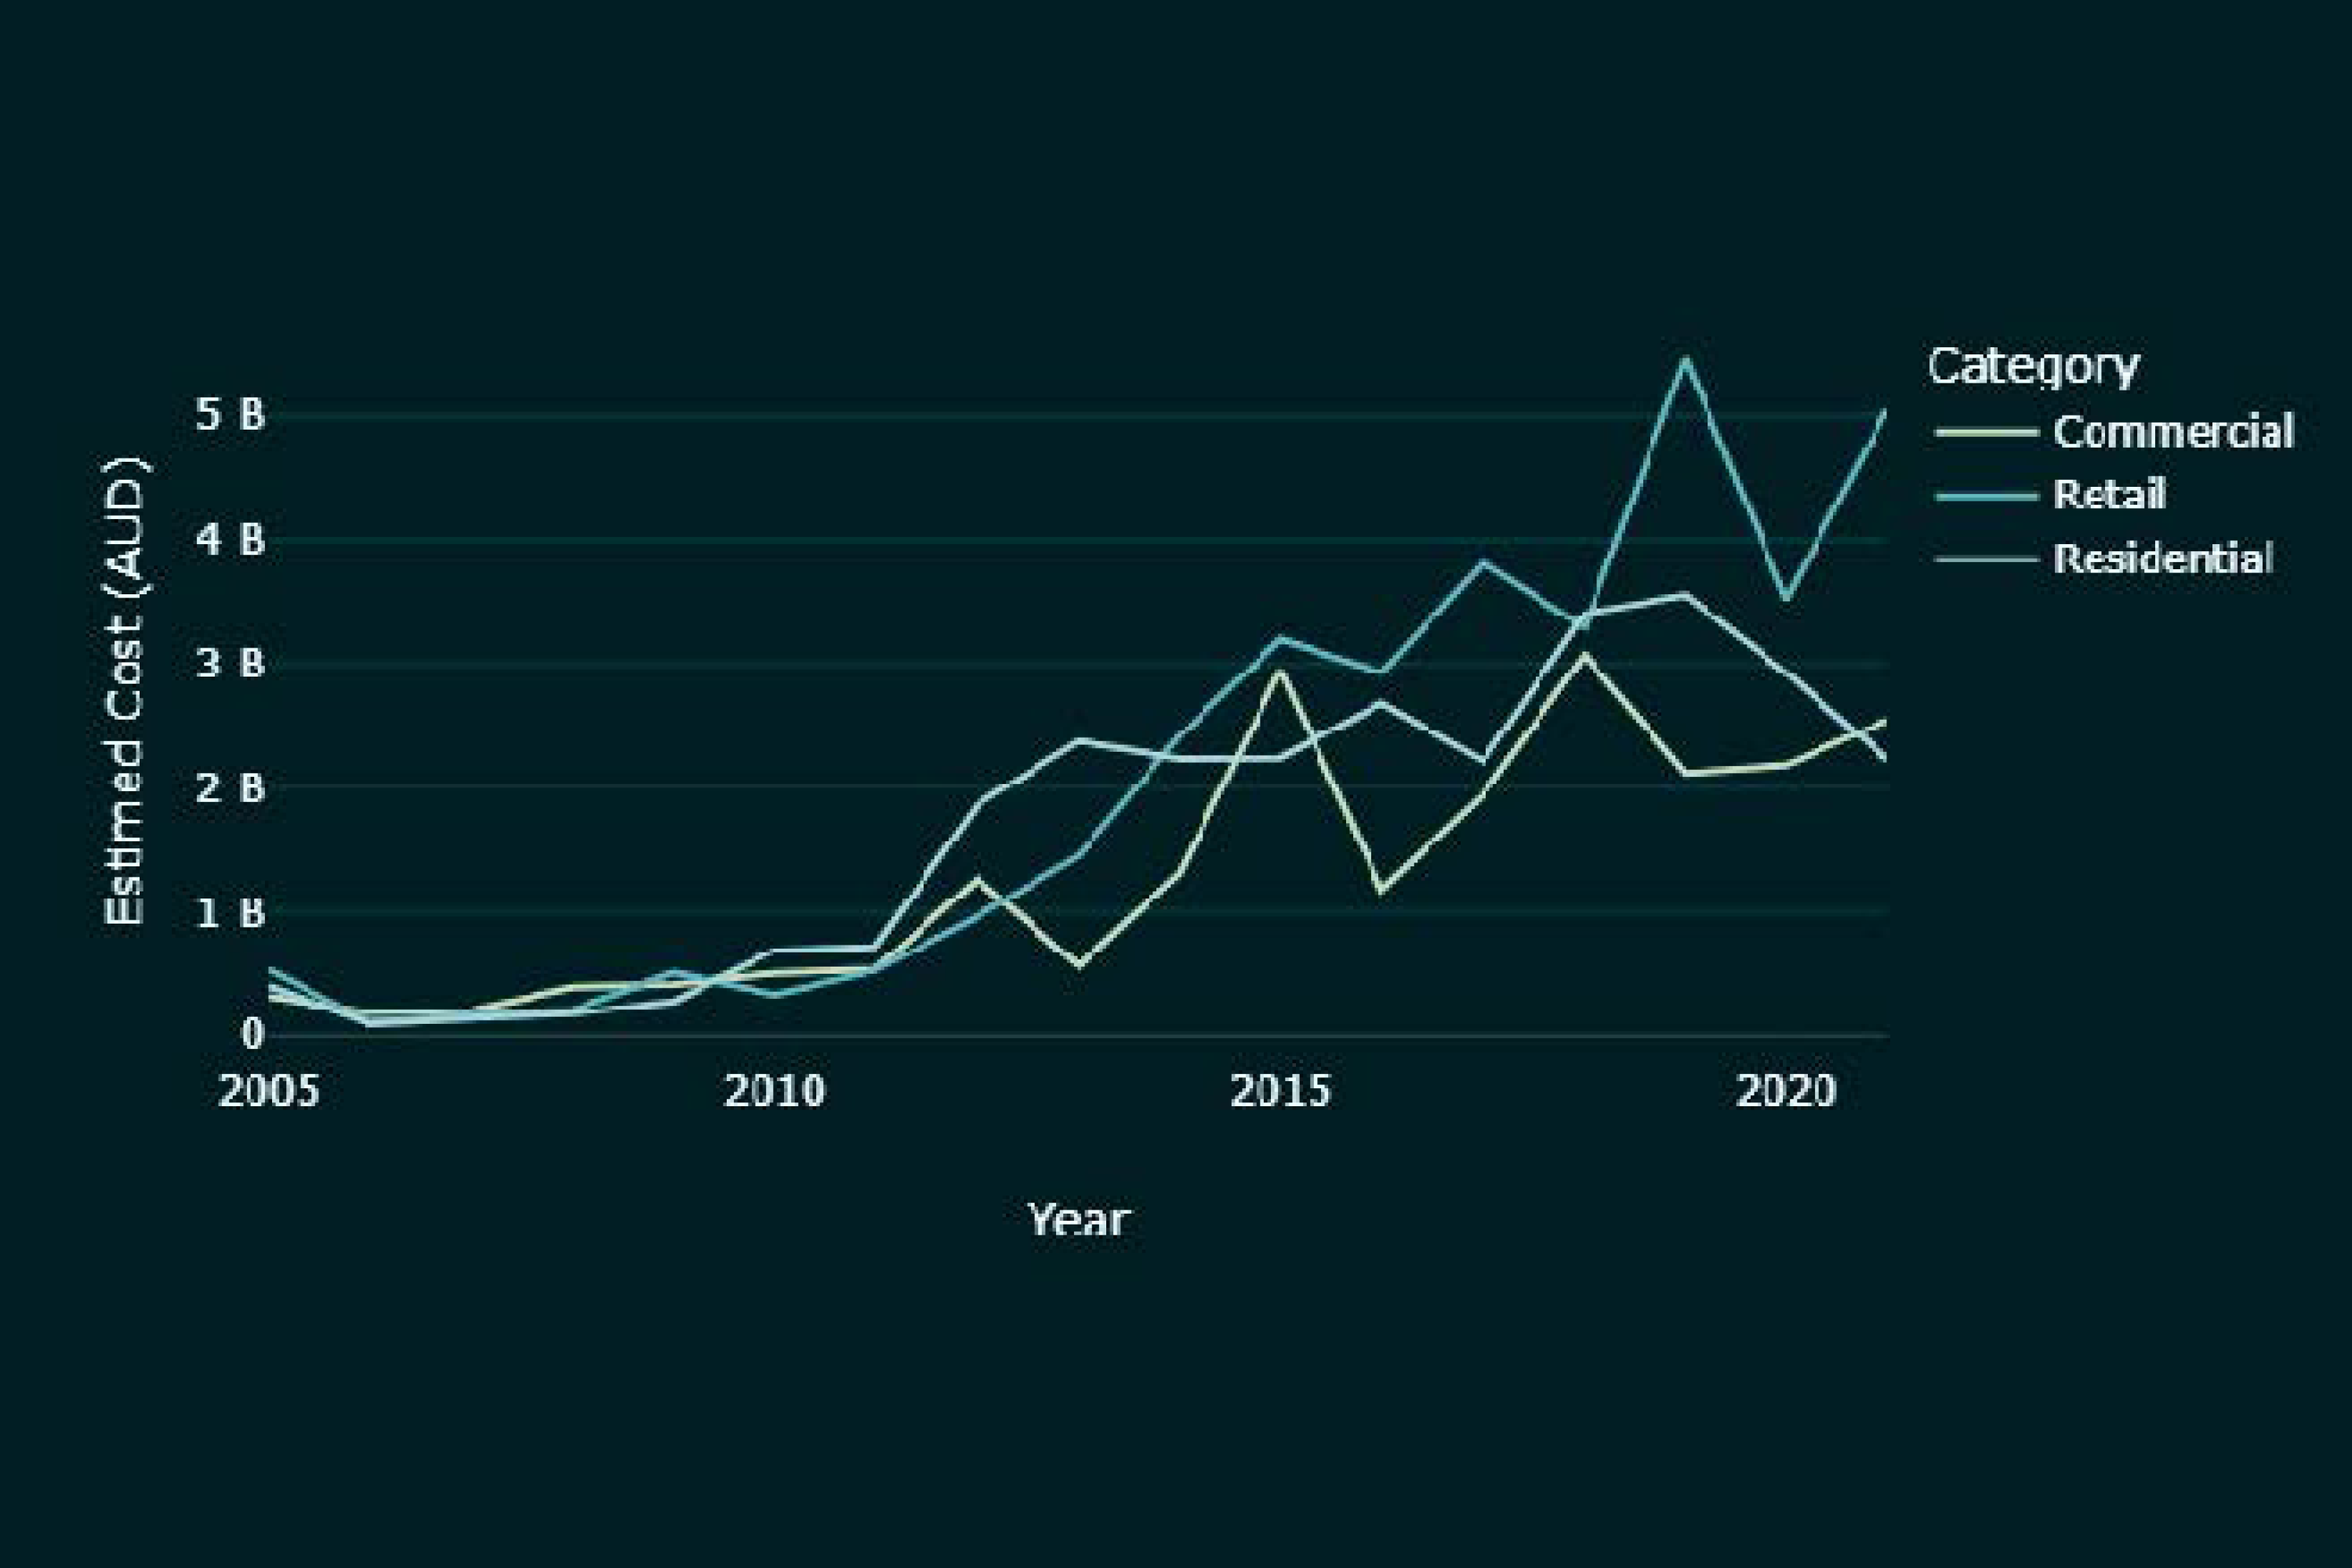
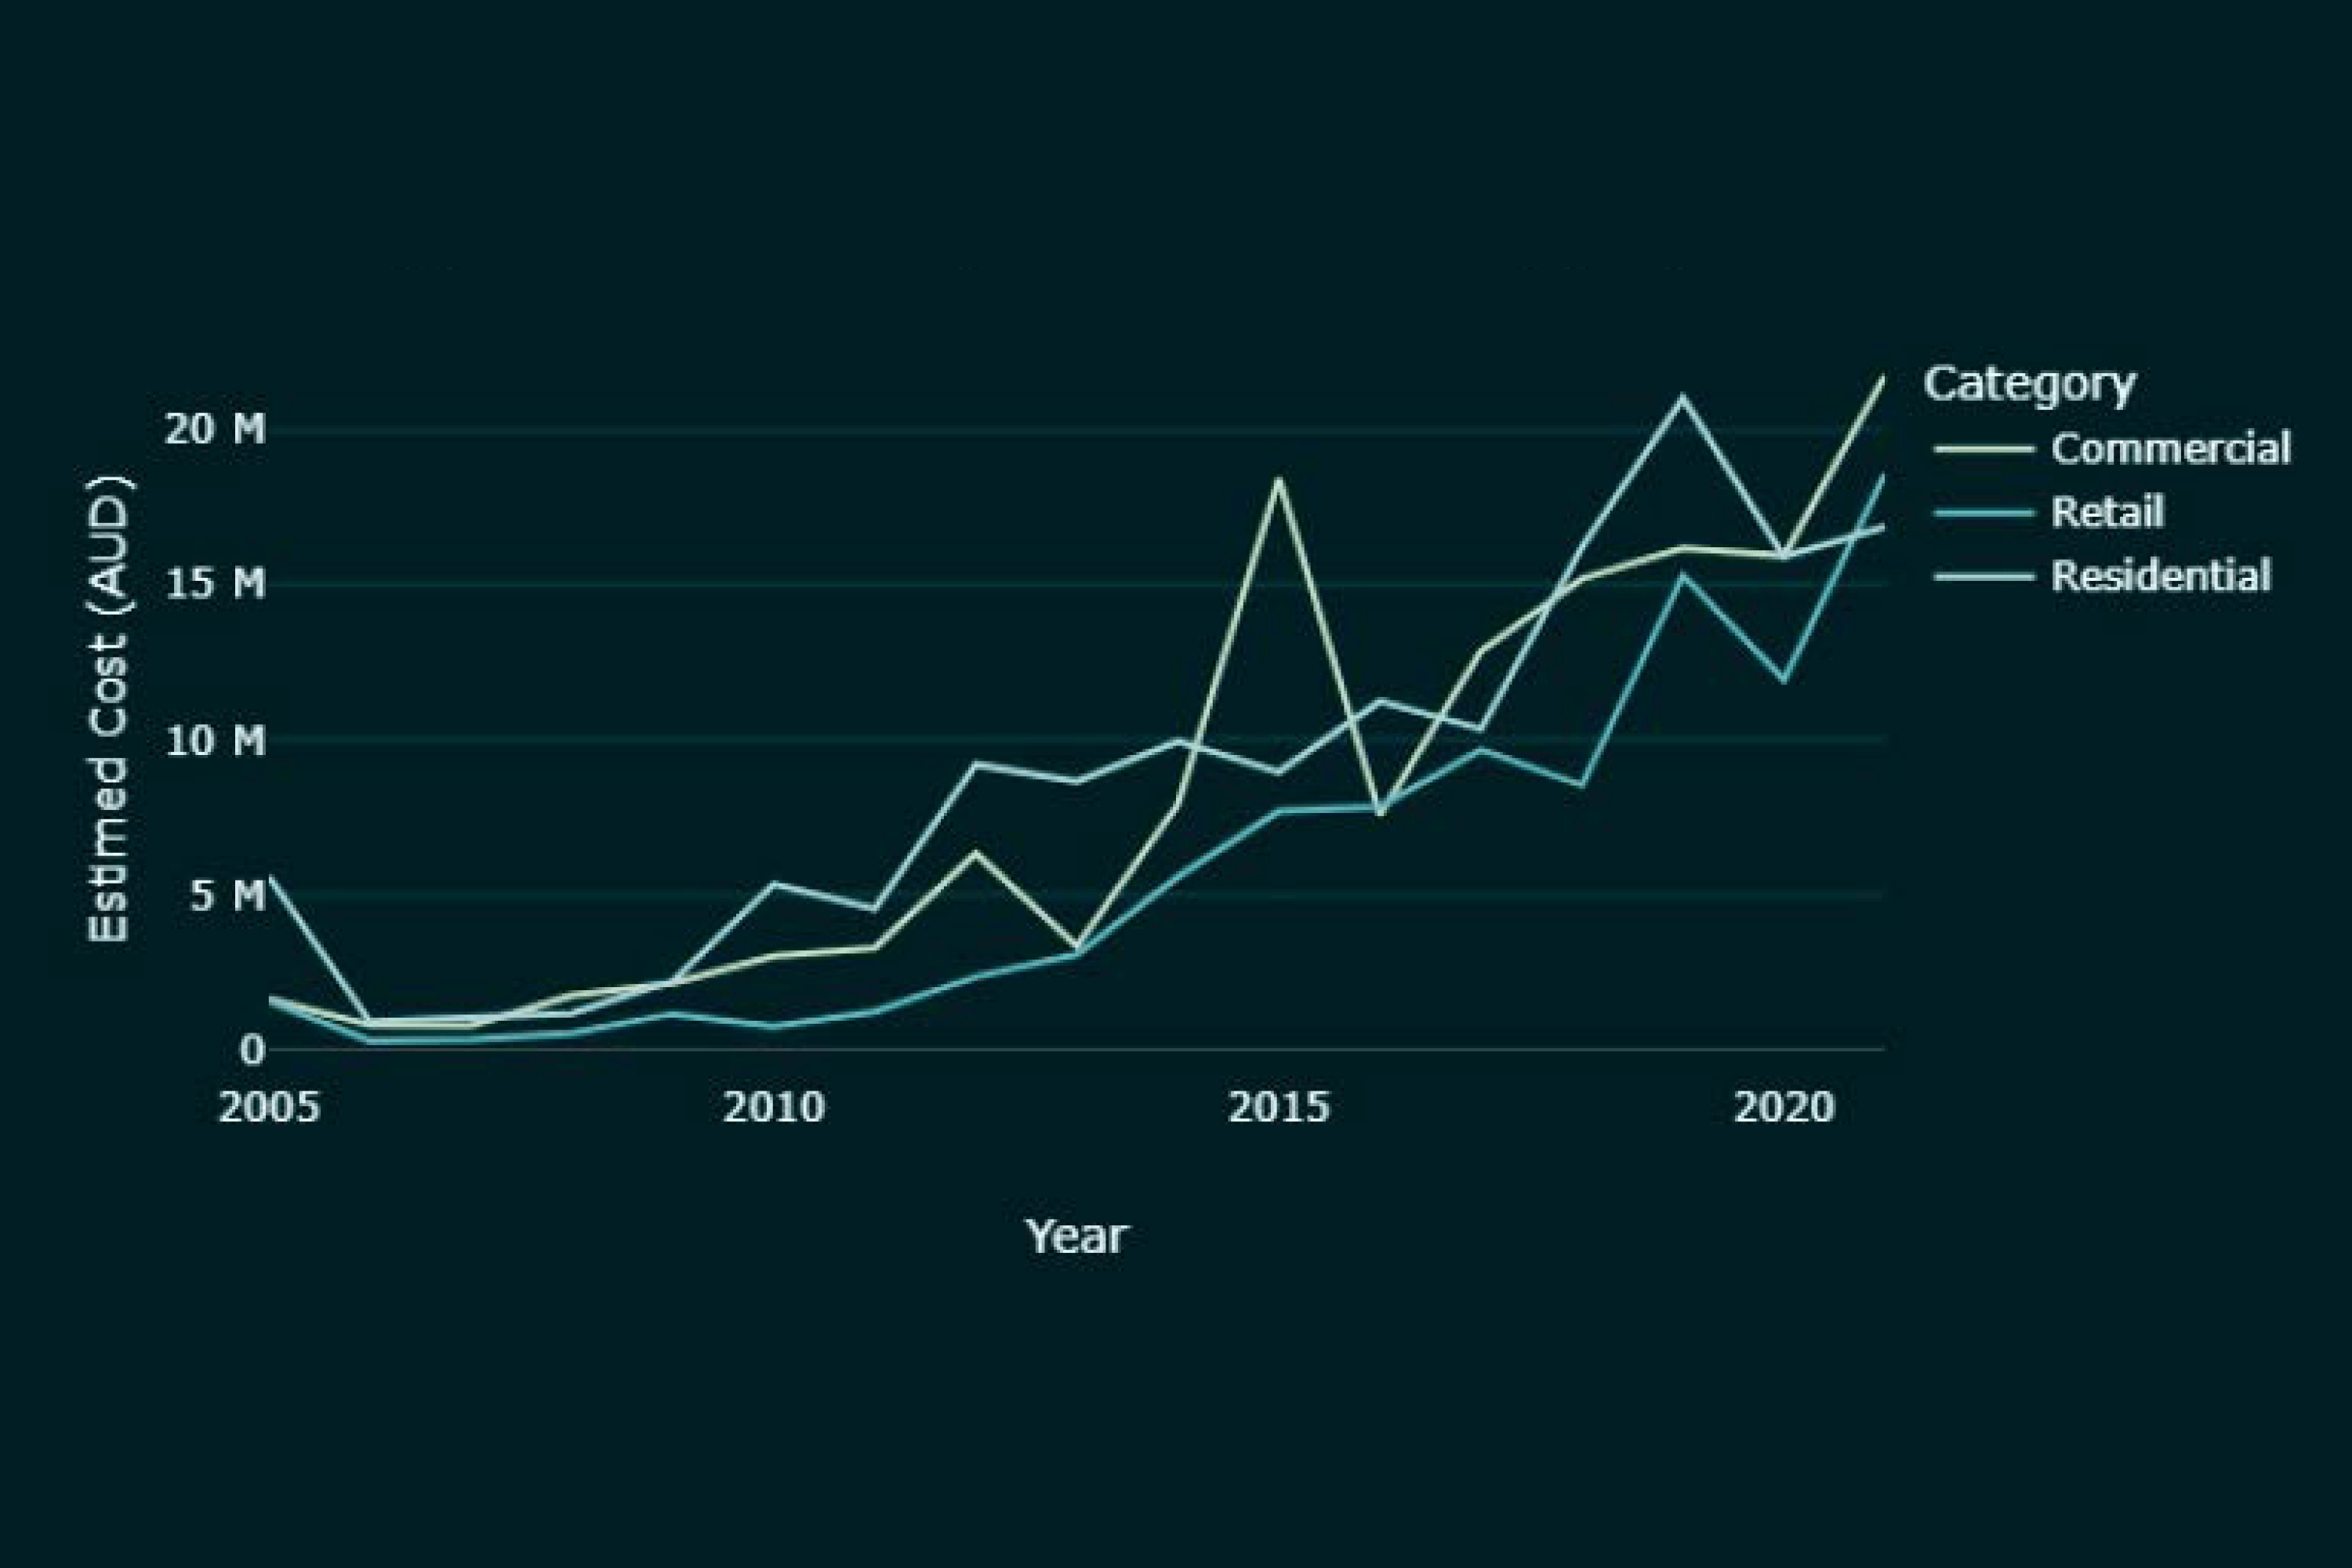
New developments change the dynamics of the place, in particular when they introduce new uses. The research exhibited patterns of evolution in proposed use of new developments. Despite a relatively stable number of developments proposing new retail, residential and commercial uses, an upward trend of total estimated cost is seen from 2008 to 2019, with a stabilisation in 2020 presumably due to COVID.

As will be discussed below, the publicly available dataset offers insufficient information about current and evolving uses of developments, limiting insights in this area. The evolution of development uses may offer valuable insights for the community, as well as inform possible evolution of land zoning rules. This accentuates the need for the Council to release more detailed open datasets to the public.

Limitations

Throughout the research process, a range of limitations were recorded due to constraints such as data availability, time and cost. These limitations are discussed below.

Improving Data Availability

In recent years, government agencies nationwide started to participate in the open data movement by digitising data and making them publicly available online. However, a large amount of data are yet to be digitised, standardised and reviewed before being made available. As a result, historical planning data such as previous LEPs are not yet available in GIS format. Digitising such data is a labour-intensive process for private individuals and is therefore not done for this research. Once such GIS data is made available, they can be added to the study to complete the picture.

Property Boundary Data Availability

Another difficulty faced in this research is the accurate mapping of DAs. DA location information is currently only available as addresses in text format. The dataset needs to be processed to have DAs allocated on maps with the right site polygon boundaries.

The initial design was to geocode the DAs before mapping the geocoded dot file on lot polygons from NSW SIX Maps. However, the free geocoding options demonstrated considerable accuracy issues, and were either limited in number of entries allowed, or very slow in processing. Google Geocoding API seemed to be more accurate, but credits are required to be purchased. After investigation, this method was deemed unsuitable given the time and cost constraints of this study.

The other approach was to find cadastre files with address information so that data can be directly joined by the address attribute. The only publicly available option found was the CoS current property boundary. However, lot boundaries change over time due to land amalgamation and subdivision. To most accurately map DAs from 2004 to 2022, all historical lot boundaries in this period are needed. The only historical boundaries found on AURIN are PSMA cadastre for 2016 to 2020. FMEWorkbench was first used to compare geometries between adjacent years to observe changes, but it picked up negligible deviations, making it challenging to identify real lot boundary changes. Manual comparison of 2016 and 2020 cadastres by colour overlay shows that changes in these four years are minor in the overall scale of CoS. Furthermore, it was noticed that even the latest PSMA cadastre has many small deviations from the CoS lot boundaries. As DAs are also Council information, it was decided that it is best to use Council property boundaries for this study.

To confirm that this deviation from best practice would not have a large impact on the accuracy of the analysis, earlier DA datasets, such as 2004, 2005 and 2006, were checked against the CoS properties boundaries. There were less than 0.5% of the DA entries that could not be matched with a lot boundary and most, if not all of them were issues with the address. It was therefore concluded that the selected approach is suitable for the purpose of this study.

In the future, should Council digitise more of the historical property boundaries, the study can be adjusted to utilise the cadastre from the respective year to further refine the results.

Existing and Proposed Land Usage

The proposed land uses in this study were inferred from the DA description field using word pattern matching based on a manual review of the data, as described in Section 3.4.5. This process lacks precision and can lead to incorrect interpretations of results. More detailed proposed usage data can be found in PDF attachments on individual DA webpages, but it would require considerable data scraping to gather, which was outside of the capacity of this study. As exemplified in the city monitor map, CoS likely already has a structured dataset of proposed usage information 28. Should Council add such information to this downloadable DA dataset in the future, the Python script can be updated to perform detailed proposed land use analysis.

Conclusions

This research designed a novel methodology for analysing individual DA data to extract spatial and temporal insights, making them available through a public dashboard. The research contributes towards filling the gap of publicly available, comprehensive, data-based spatiotemporal knowledge of development patterns.

With this case study of CoS DAs between 2004 and 2022, the approach focused on four research questions. The first two examined patterns of spatiotemporal distribution in terms of number of DAs or estimated costs. The third investigated patterns of evolution in development use such as residential, commercial and retail. The last question looked at assessment times and their possible influence on developments.

The study used in-depth Python analysis of CoS DA data combined with geographical property and suburb boundaries to produce charts and maps of macro-level development patterns. Moran’s I and spatial autocorrelation analysis helped highlight hot spots and cold spots at the level of individual suburbs. The analysis can be run again with updated datasets in the future to reveal further insights, making it a useful tool for other practitioners.

The results show a heavy development focus on specific suburbs such as the Sydney CBD and Zetland, both in terms of number of DAs and total estimated costs. Cold spots were identified in the west and the middle of the LGA, such as the localities of Glebe, Newtown, Erskineville, Eveleigh and Redfern, corresponding with a higher concentration of heritage conservation areas.

An investigation of new development uses highlighted rising costs across residential, commercial and retail developments, but insufficient information availability limited the depth of insights, especially when it comes to existing use which was missing from the dataset.

An analysis of DA assessment times across years and as a function of estimated cost showed a small but positive correlation between estimated costs and assessment time. It also indicated that although the majority of DAs are reviewed under three months, more than 20% require a longer time frame, which can be a significant constraint in the development process.

Further Applications

Broader Time Scale Investigation

As noted earlier in this paper, CoS DA information is currently available online from November 2004 onwards, limiting the scope of this study. Some of the older DA records (called Building Application or BA in earlier times) can be found at the CoS Archives & History Resources, where records assessed as being of permanent value are kept 63. These records currently have limited information and there is no automated way to download the full list of such applications. Once these older DA records are better digitised, they can be used to expand the study scope to provide a fuller review of the Sydney development history.

Building Height Compliance and Other Detailed Investigations

DAs contain considerably more information than what is available in this open dataset. Missing information includes proposed use category, building height, number of levels above and below ground, number of car parking spots and number of apartments, etc. As exemplified in Section 5.4.3, most of this information can be found in PDFs on individual DA webpages but requires extensive data scraping to gather it. If CoS adds the abovementioned information to this downloadable DA dataset, this study can broaden to provide spatiotemporal insights into areas such as building height compliance, residential density, housing typology distribution and car dependency.

Other Development Data

As mentioned early in this document, there are other types of developments in the CoS LGA, such as major projects. These large-scale projects, although not managed by the local government, often make a large impact on the LGA. Similarly, planning proposals that directly modify planning controls are another potentially interesting area of change to monitor in CoS. By combining these different pieces of the puzzle, a more complete picture of Sydney’s development pattern may be presented.

Wider Geographical Area

The process in this research is tailored to the data availability and format of the CoS LGA but has the potential to be adapted for other LGAs in NSW as well as other states. In fact, some local governments, such as Brisbane, directly provide proposed usage information 63. This means the data processing could be fast-tracked in such cases. This implies that by adjusting the Python scripting, this study has the potential to expand to national level. Higher-level patterns across state and territories can help compare development approaches Australia-wide.

Recommendations

This paper revealed clear spatiotemporal insights based on a limited dataset of DAs in the CoS area between 2004 and 2022. While this outcome could only be achieved thanks to the availability of open datasets, in depth insights were limited by the quality and structure of the data, and in breadth by the limited spatiotemporal scope.

This highlights the importance of coordination at higher levels of government to design shared, well-structured open data formats and to encourage all LGAs to adopt them. Such efforts would enable powerful visualisations of spatiotemporal phenomena and help engage the community throughout the planning process, further strengthening a productive collaboration towards a common goal.

Notes

References
1. Searle, G.H. Population growth and development: An outcome of Sydney’s metropolitan governance. Aust. Plan. 2020, 56, 65–72. [CrossRef]
2. Greater Sydney Commission. Past, Present and Future. Available online: https://www.greater.sydney/content/past-presentand- future (accessed on 11 June 2022).
3. Australian Bureau of Statistics. Regional Population. Available online: https://www.abs.gov.au/statistics/people/population/ regional-population/latest-release#capital-cities (accessed on 11 June 2022).
4. Greater Cities Commission. A Metropolis of Three Cities. Available online: https://greatercities.au/metropolis-of-three-cities (accessed on 11 June 2022).
5. City of Sydney. City of Sydney Notification of Planning and Development Applications Development Control Plan 2005. Available online: https://www.cityofsydney.nsw.gov.au/development-control-plans/notification-planning-development-applicationsdcp- 2005 (accessed on 16 August 2021).
6. Smith, S. The NSW Planning System: Proposed Reforms. Available online: https://www.parliament.nsw.gov.au/researchpapers/ Pages/the-nsw-planning-system-proposed-reforms.aspx (accessed on 17 August 2021).
7. The World Bank. Defining the Planning Framework. Available online: https://urban-regeneration.worldbank.org/node/50 (accessed on 18 July 2021).
8. NSW Government. New Portal Makes Planning System Easier. Available online: https://www.planningportal.nsw.gov.au/ news/new-portal-makes-planning-system-easier (accessed on 14 August 2021).
9. CSIRO. Launch of the NSW Spatial Digital Twin: Better Planning, Design and Management of Australian Citie. Available online: https://research.csiro.au/icv/nsw-digital-twin/ (accessed on 15 August 2021).
10. Hawken, S.; Han, H.; Pettit, C. (Eds.) Open Cities|Open Data: Collaborative Cities in the Information Era; Palgrave Macmillan: London, UK; Springer: Singapore, 2020.
11. Jacobs, J. The Death and Life of Great American Cities; Vintage Books: New York, NY, USA, 1992.
12. Thompson, S.; Maginn, P.J. Planning Australia: An Overview of Urban and Regional Planning, 2nd ed.; Cambridge University Press: Cambridge, NY, USA, 2012.
13. World Green Building Council. New Report: The Building and Construction Sector Can Reach Net Zero Carbon Emissions by 2050. Available online: https://www.worldgbc.org/news-media/WorldGBC-embodied-carbon-report-published (accessed on 17 August 2021).
14. Bauer, K.L. Reforms to the NSW Planning System & Introduction of a New Assessment Process for State Significant Development: A Case Study. Available online: https://papers.ssrn.com/sol3/papers.cfm?abstract_id=1021485 (accessed on 17 August 2021).
15. McFarland, P. The best planning system in Australia or a system in need of review? An analysis of the New SouthWales planning system. Plan. Perspect. 2011, 26, 403–422. [CrossRef]
16. City of Sydney. Committee Details. Available online: https://meetings.cityofsydney.nsw.gov.au/mgCommitteeDetails.aspx?ID= 139 (accessed on 25 July 2021).
17. NSW Government. Development Assessment Exempt Development. Available online: https://www.planningportal.nsw.gov.au/ development-assessment/exempt-development (accessed on 1 April 2021).
18. NSW Government. Planning Approval Pathways: Complying Development. Available online: https://pp.planningportal.nsw. gov.au/onlinecdc (accessed on 25 July 2021).
19. NSW Government. State Significant Development. Available online: https://www.planning.nsw.gov.au/Assess-and-Regulate/ Development-Assessment/Planning-Approval-Pathways/State-Significant-Development (accessed on 25 July 2021).
20. NSW Government. Major Project Assessments. Available online: http://majorprojects.planning.nsw.gov.au/page/ (accessed on 25 July 2021).
21. Ruming, K. Facilitating faster approval: Council reflections on the changing NSW planning and development assessment process. In Proceedings of the 4th State of Australian Cities Conference, Perth, Australia, 24–27 November 2009.
22. NSW Government. Part 3A Development. Available online: https://www.planning.nsw.gov.au/Assess-and-Regulate/ Development-Assessment/Planning-Approval-Pathways/Part-3a-Development (accessed on 25 July 2021).
23. NSW Government. Major Projects. Available online: https://www.planningportal.nsw.gov.au/major-projects/ (accessed on 24 March 2021).
24. NSW Government. Local Development. Available online: https://www.planning.nsw.gov.au/Assess-and-Regulate/ Development-Assessment/Planning-Approval-Pathways/Local-Development (accessed on 25 July 2021).
25. City of Sydney. Development Application Search Results. Available online: https://online2.cityofsydney.nsw.gov.au/DA/ IndividualApplication?tpklapappl=1454583 (accessed on 24 July 2021).
26. City of Sydney. On Exhibition—All Applications. Available online: https://online2.cityofsydney.nsw.gov.au/DA/OnExhibitions (accessed on 24 July 2021).
27. City of Sydney. City Monitor Reports. Available online: https://www.cityofsydney.nsw.gov.au/surveys-case-studies-reports/ city-monitor-reports (accessed on 24 July 2021).
28. City of Sydney. Development Monitoring. Available online: https://cityofsydney.maps.arcgis.com/apps/webappviewer/index. html?id=ab67ecb8c37f4ae38ac77066e02b03fe (accessed on 24 July 2021).
29. World Heath Organisation. WHO Director-General’s Opening Remarks at the Media Briefing on COVID-19—11 March 2020. Available online: https://www.who.int/dg/speeches/detail/who-director-general-s-opening-remarks-at-the-media-briefingon- covid-19---11-march-2020 (accessed on 6 October 2020).
30. Albani, M. There Is No Returning to Normal after COVID-19. But There is a Path Forward. Available online: https://www. weforum.org/agenda/2020/04/covid-19-three-horizons-framework/ (accessed on 6 October 2020). Buildings
31. Greater Sydney Commision. City-Shaping Impacts of COVID-19: Towards a Resilient Greater Sydney. Available online: https://greatercities.au/thought-leadership/city-shaping-impacts-of-covid-19 (accessed on 11 June 2022).
32. United Nations. Policy Brief: COVID-19 in an Urban World; United Nations: New York, NY, USA, 2020.
33. Maginn, P.J.; Mortimer, G. How COVID All but Killed the Australian CBD; The University of Western Australia: Crawley, Australia, 2020.
34. Australian Government Centre for Population. Insights from Australia’s First Population Statement. Available online: https: //population.gov.au/publications/publications-population-statement.html (accessed on 18 August 2021).
35. O’Sullivan, M. COVID-19 to Reshape Sydney in ‘Biggest Way’ since Spanish Flu as Population Stalls. Available online: https://www.smh.com.au/national/nsw/covid-19-to-reshape-sydney-in-biggest-way-since-spanish-flu-as-populationstalls- 20201011-p56412.html (accessed on 18 August 2021).
36. Thakur, P.; Rawnsley, T. COVID-19 Impacts Both Cities and Regional Population Growth. Available online: https://newsroom. kpmg.com.au/covid-19-impacts-cities-regional-population-growth/ (accessed on 18 August 2021).
37. Sharifi, A.; Khavarian-Garmsir, A.R. The COVID-19 pandemic: Impacts on cities and major lessons for urban planning, design, and management. Sci. Total Environ. 2020, 749, 142391. [CrossRef] [PubMed]
38. Malczewski, J.; Rinner, C. Multicriteria Decision Analysis in Geographic Information Science; Springer Science & Business Media: New York, NY, USA, 2015.
39. Malczewski, J. GIS-based land-use suitability analysis: A critical overview. Prog. Plan. 2004, 62, 3–65. [CrossRef]
40. Environment, N.D.o.P.a. Online Portal Speeds Up Planning in NSW. Available online: https://pp.planningportal.nsw.gov.au/ news/online-portal-speeds-planning-nsw (accessed on 18 August 2021).
41. Manandhar, R.; Odeh, I.; Ancev, T. Assessment of Spatial-Temporal Expansion of Built-up and Residential-Commercial Dwellings with Some Economic Implications: A Case Study in the Lower Hunter of Eastern Australia. Land 2014, 3, 239–259. [CrossRef]
42. Liu, Y.; Wang, L.; Long, H. Spatio-temporal analysis of land-use conversion in the eastern coastal China during 1996–2005. J. Geogr. Sci. 2008, 18, 274–282. [CrossRef]
43. Liu, Y.; Lu, S.; Chen, Y. Spatio-temporal change of urban–rural equalized development patterns in China and its driving factors. J. Rural Stud. 2013, 32, 320–330. [CrossRef]
44. Li, Y.; Long, H.; Liu, Y. Spatio-temporal pattern of China’s rural development: A rurality index perspective. J. Rural Stud. 2015, 38, 12–26. [CrossRef]
45. Unpingco, J. Python Programming for Data Analysis, 1st ed.; Springer International Publishing: Cham, Switzerland, 2021.
46. City of Sydney. City of Sydney Community Profile. Available online: https://profile.id.com.au/sydney (accessed on 11 June 2022).
47. Australian Bureau of Statistics. Population Estimates and Components by LGA, 2020 to 2021; Australian Bureau of Statistics: Canberra, Australia, 2022.
48. City of Sydney. Historic Council Boundaries. Available online: https://cityofsydney.maps.arcgis.com/apps/MapSeries/index. html?appid=8cf4c625fd924e38a14d40e8ff1960a0 (accessed on 31 July 2021).
49. Department of Industry, Science and Resources. NSW Suburb/Locality Boundaries—Geoscape Administrative Boundaries; Department of Industry, Science and Resources: Canberra, Australia, 2021.
50. City of Sydney. Property Boundaries; City of Sydney: Sydney, Australia, 2021.
51. City of Sydney. Find a Development Application or a Footway Usage Application. Available online: https://online2.cityofsydney. nsw.gov.au/DA (accessed on 24 March 2021).
52. Department of Planning. Land Use Matrix—August 2020—NSW Department of Planning; The New SouthWales Department of Planning and Environment: Parramatta, Australia, 2020.
53. Griffith, D.A. Spatial Autocorrelation. Available online: https://citeseerx.ist.psu.edu/viewdoc/download?doi=10.1.1.104.7898& rep=rep1&type=pdf (accessed on 19 August 2021).
54. Waters, N. Tobler’s First Law of Geography. Int. Encycl. Geogr. People Earth Environ. Technol. 2017, 1–13. [CrossRef]
55. Kraak, M.-J. The space-time cube revisited from a geovisualization perspective. In Proceedings of the 21st International Cartographic Conference, Durban, South Africa, 10–16 August 2003.
56. Lenntorp, B. Time-Geography—At the End of Its Beginning. GeoJournal 1999, 48, 155–158. [CrossRef]
57. ESRI. How Create Spaces Time Cube Works. Available online: https://pro.arcgis.com/en/pro-app/latest/tool-reference/spacetime- pattern-mining/learnmorecreatecube.htm (accessed on 6 August 2021).
58. Australian Bureau of Statistics. Australian Statistical Geography Standard (ASGS) Edition 3. Available online: https:// www.abs.gov.au/statistics/standards/australian-statistical-geography-standard-asgs-edition-3/jul2021-jun2026 (accessed on 6 August 2021).
59. Parliament of Australia. COVID-19: A Chronology of State and Territory Government Announcements (up until 30 June 2020). Available online: https://www.aph.gov.au/About_Parliament/Parliamentary_Departments/Parliamentary_Library/pubs/ rp/rp2021/Chronologies/COVID-19StateTerritoryGovernmentAnnouncements (accessed on 12 August 2021).
60. Brown, J. Behind Sydney’s Award-Winning Urban Renewal of the Green Square Project. Available online: https://www. commercialrealestate.com.au/news/behind-sydneys-award-winning-urban-renewal-of-the-green-square-project-1026014/ (accessed on 14 August 2021).
61. NSW Government. ePlanning Spatial Viewer. Available online: https://www.planningportal.nsw.gov.au/spatialviewer/#/finda- property/address (accessed on 19 August 2021).
62. City of Sydney. Guide to Records of Development and Building. Available online: https://archives.cityofsydney.nsw.gov.au/ nodes/view/1903971#idx2824233 (accessed on 24 July 2021).
63. Brisbane City Council. Developmenti. Available online: https://developmenti.brisbane.qld.gov.au/Home/MapSearch (accessed on 24 July 2021).